Mark Khusid
import pandas as pd
import numpy as np

import matplotlib.pyplot as plt
from matplotlib.pyplot import get_cmap

from scipy.integrate import simpson

from sklearn.impute import KNNImputer
from sklearn.cluster import KMeans, DBSCAN
from sklearn.decomposition import PCA

from sklearn.preprocessing import StandardScaler
Load the datasets
insulin_data = pd.read_csv('InsulinData.csv', low_memory=False)
cgm_data = pd.read_csv('CGMData.csv', low_memory=False)
View Dataframes
insulin_dataLoading...
#insulin_data['BWZ Carb Input (grams)']cgm_dataLoading...
EDA on dataframes
#insulin_data.info()cgm_data.info()<class 'pandas.core.frame.DataFrame'>
RangeIndex: 55343 entries, 0 to 55342
Data columns (total 47 columns):
# Column Non-Null Count Dtype
--- ------ -------------- -----
0 Index 55343 non-null int64
1 Date 55343 non-null object
2 Time 55343 non-null object
3 New Device Time 0 non-null float64
4 BG Reading (mg/dL) 0 non-null float64
5 Linked BG Meter ID 0 non-null float64
6 Basal Rate (U/h) 0 non-null float64
7 Temp Basal Amount 0 non-null float64
8 Temp Basal Type 0 non-null float64
9 Temp Basal Duration (h:mm:ss) 0 non-null float64
10 Bolus Type 0 non-null float64
11 Bolus Volume Selected (U) 0 non-null float64
12 Bolus Volume Delivered (U) 0 non-null float64
13 Bolus Duration (h:mm:ss) 0 non-null float64
14 Prime Type 0 non-null float64
15 Prime Volume Delivered (U) 0 non-null float64
16 Alarm 0 non-null float64
17 Suspend 0 non-null float64
18 Rewind 0 non-null float64
19 BWZ Estimate (U) 0 non-null float64
20 BWZ Target High BG (mg/dL) 0 non-null float64
21 BWZ Target Low BG (mg/dL) 0 non-null float64
22 BWZ Carb Ratio (g/U) 0 non-null float64
23 BWZ Insulin Sensitivity (mg/dL/U) 0 non-null float64
24 BWZ Carb Input (grams) 0 non-null float64
25 BWZ BG Input (mg/dL) 0 non-null float64
26 BWZ Correction Estimate (U) 0 non-null float64
27 BWZ Food Estimate (U) 0 non-null float64
28 BWZ Active Insulin (U) 0 non-null float64
29 Sensor Calibration BG (mg/dL) 0 non-null float64
30 Sensor Glucose (mg/dL) 51175 non-null float64
31 ISIG Value 51175 non-null float64
32 Event Marker 1 non-null object
33 Bolus Number 0 non-null float64
34 Bolus Cancellation Reason 0 non-null float64
35 BWZ Unabsorbed Insulin Total (U) 0 non-null float64
36 Final Bolus Estimate 0 non-null float64
37 Scroll Step Size 0 non-null float64
38 Insulin Action Curve Time 0 non-null float64
39 Sensor Calibration Rejected Reason 0 non-null float64
40 Preset Bolus 0 non-null float64
41 Bolus Source 0 non-null float64
42 Network Device Associated Reason 0 non-null float64
43 Network Device Disassociated Reason 0 non-null float64
44 Network Device Disconnected Reason 0 non-null float64
45 Sensor Exception 4167 non-null object
46 Preset Temp Basal Name 0 non-null float64
dtypes: float64(42), int64(1), object(4)
memory usage: 19.8+ MB
Convert ‘Date’ and ‘Time’ columns to datetime format in both datasets for easier manipulation
def preprocess_date(date_string):
    date_string = date_string.strip()
    if len(date_string.split()) == 1:
        return date_string
    elif len(date_string.split()) == 2:
        return date_string.split()[0]
insulin_data['Date'] = insulin_data['Date'].apply(preprocess_date)insulin_data['datetime'] = pd.to_datetime(insulin_data['Date'] + ' ' + insulin_data['Time'])
cgm_data['datetime'] = pd.to_datetime(cgm_data['Date'] + ' ' + cgm_data['Time'])insulin_data[['Date', 'Time', 'datetime']]Loading...
cgm_data[['Date', 'Time', 'datetime']]Loading...
Search for non-zero BMZ Carb Input Data
# This datetime series contains the start of all non NaN and  positive carb input
# data from the column BWZ Carb Input (grams)
meal_times = \
    insulin_data[~insulin_data['BWZ Carb Input (grams)'].isna() & \
    (insulin_data['BWZ Carb Input (grams)'] > 0)]['datetime']
meal_times
48 2018-02-12 09:15:45
129 2018-02-12 02:30:55
188 2018-02-11 20:33:18
207 2018-02-11 18:14:37
222 2018-02-11 16:27:04
...
41265 2017-07-26 11:24:52
41274 2017-07-26 09:27:16
41347 2017-07-25 18:31:40
41393 2017-07-25 10:39:46
41401 2017-07-25 10:21:19
Name: datetime, Length: 747, dtype: datetime64[ns]meal_times.indexIndex([ 48, 129, 188, 207, 222, 235, 261, 300, 432, 486,
...
41139, 41164, 41172, 41214, 41261, 41265, 41274, 41347, 41393, 41401],
dtype='int64', length=747)Extract Meal Carb Data
Obtain Carb Data At Meal Times
meal_carb_data = []

for i in meal_times.index:
meal_carb_data.append(insulin_data['BWZ Carb Input (grams)'].iloc[i])len(meal_carb_data)747meal_carb_data[0:10][np.float64(34.0),
np.float64(15.0),
np.float64(71.0),
np.float64(8.0),
np.float64(40.0),
np.float64(9.0),
np.float64(27.0),
np.float64(10.0),
np.float64(40.0),
np.float64(90.0)]len(meal_carb_data)747Bin Calculations
Obtain Max and Min Meal Carbs
max_meal_carbs = np.max(meal_carb_data)
max_meal_carbsnp.float64(129.0)min_meal_carbs = np.min(meal_carb_data)
min_meal_carbsnp.float64(3.0)Calculate Number of Bins
bin_size = 20 # grams

number_of_bins = int(np.round(((max_meal_carbs - min_meal_carbs) / bin_size), decimals = 0))
number_of_bins6Create Bins
# Create 6 bins in the range of the data
bin_boundaries = np.linspace(min_meal_carbs, max_meal_carbs, 6)
print("Bin boundaries:", bin_boundaries)
Bin boundaries: [ 3. 28.2 53.4 78.6 103.8 129. ]
Extract Meal Glucose Data
Obtain CGM Data based on Length of After-Meal Window
# Initialize meal data list
meal_glucose_data = []
meal_carb_for_analysis_data = []

# Loop through each meal start time
for index, meal_time in meal_times.items():
    # A meal windows is 2 hours long
    meal_window = insulin_data[(insulin_data['datetime'] > meal_time) &
                               (insulin_data['datetime'] <= (meal_time + pd.Timedelta(hours=2)))]
    #print(meal_window)

    # If that meal window is empty, get corresponding CGM_
    # data that starts at tm-30 and ends at tm+2hrs
    if meal_window.empty:
        # Step 4 condition (a): No meal between tm and tm+2hrs, use this stretch as meal data
        meal_cgm_data = cgm_data[(cgm_data['datetime'] >= (meal_time - pd.Timedelta(minutes=30))) &
                                 (cgm_data['datetime'] <= (meal_time + pd.Timedelta(hours=2)))]
    else:
        # Step 4 check for condition (b) or (c)
        next_meal_time = meal_window.iloc[0]['datetime']
        if next_meal_time < (meal_time + pd.Timedelta(hours=2)):
            # condition (b): There is a meal at tp between tm and tm+2hrs, use tp data
            meal_time = next_meal_time
            meal_cgm_data = cgm_data[(cgm_data['datetime'] >= (meal_time - pd.Timedelta(minutes=30))) &
                                     (cgm_data['datetime'] <= (meal_time + pd.Timedelta(hours=2)))]
        # Condition (c): There is a meal exactly at tm+2hrs, use tm+1hr 30min to tm+4hrs
        elif next_meal_time == (meal_time + pd.Timedelta(hours=2)):
            meal_cgm_data = cgm_data[(cgm_data['datetime'] >= (meal_time + pd.Timedelta(hours=1, minutes=30))) &
                                     (cgm_data['datetime'] <= (meal_time + pd.Timedelta(hours=4)))]

    # Check if the extracted data has the correct number of points (30 for meal data)
    if len(meal_cgm_data) == 30:
        #print(f"Meal Time Data {meal_time} has {len(meal_cgm_data)} number of points.")
        meal_glucose_data.append(meal_cgm_data['Sensor Glucose (mg/dL)'].values)
        meal_carb_for_analysis_data.append(insulin_data['BWZ Carb Input (grams)'].iloc[index])
Get Length of Meal Data CGM Values
len(meal_glucose_data)715len(meal_carb_for_analysis_data)715Assign Each Meal to a Bin
meal_bin_indices = np.digitize(meal_carb_for_analysis_data, bin_boundaries, right=False)
meal_bin_indices = meal_bin_indices - 1
print("Bin indices:", meal_bin_indices)
Bin indices: [1 0 2 0 1 0 0 1 3 2 0 2 0 1 1 1 0 0 0 2 1 1 0 2 1 1 1 0 1 0 0 0 1 0 2 3 0
2 0 0 0 0 3 0 2 0 3 0 0 1 0 2 0 0 0 0 0 0 1 0 1 0 0 2 0 1 0 0 0 0 0 1 0 1
1 1 3 1 0 1 1 1 0 1 2 1 1 0 0 1 0 0 1 1 2 1 1 1 0 3 0 0 1 1 0 0 2 1 1 0 0
0 1 1 0 1 0 1 0 2 0 1 1 0 1 1 0 0 0 1 1 0 1 0 3 0 1 0 1 0 1 0 1 0 3 0 2 1
1 0 0 1 0 0 0 0 0 0 1 1 0 0 0 0 3 0 0 3 0 1 0 0 1 2 0 0 2 0 0 1 0 0 1 0 0
1 2 0 1 0 0 0 0 0 2 0 2 0 0 1 0 1 1 0 0 3 0 0 0 0 0 0 3 3 1 2 0 0 2 0 0 1
2 0 2 0 0 1 0 2 0 0 0 0 0 2 0 0 1 0 1 0 2 0 3 0 2 1 1 0 0 2 0 2 2 0 0 1 0
1 1 0 1 0 1 0 0 1 1 2 1 0 1 2 2 0 1 3 1 0 3 0 1 2 0 1 0 1 2 0 0 0 0 0 0 0
0 3 0 0 2 0 1 2 0 2 0 0 2 2 4 0 2 1 1 0 2 1 2 1 0 0 2 2 1 0 0 0 1 2 0 1 0
2 2 0 0 1 2 0 0 0 0 2 0 0 0 0 1 1 3 0 3 2 0 0 1 1 0 2 1 2 0 3 0 0 1 2 0 0
0 1 0 0 0 1 0 0 1 2 1 1 2 0 1 1 0 2 1 0 1 3 1 0 1 2 0 0 1 0 1 0 0 1 0 3 0
0 0 0 2 0 1 2 3 1 3 2 1 2 0 3 0 0 0 0 2 0 0 3 3 0 0 1 1 0 2 0 2 2 0 1 2 2
2 0 2 2 2 0 2 2 2 1 0 0 2 0 2 2 2 2 2 2 0 0 1 1 1 0 3 0 2 1 0 2 1 2 2 1 1
0 1 0 0 1 1 1 0 1 1 0 1 0 2 1 0 0 0 1 2 1 1 1 2 0 1 1 2 3 1 1 2 3 1 1 1 0
1 0 1 2 2 1 2 2 0 1 0 1 0 3 0 1 1 1 3 1 0 1 2 0 3 0 1 0 0 1 3 1 3 2 1 2 0
0 0 3 0 2 2 0 1 0 0 1 2 3 2 0 1 3 1 0 1 0 3 4 4 2 1 3 0 0 3 1 1 3 3 1 1 0
2 0 1 1 2 3 2 1 1 0 3 1 0 1 1 1 0 0 3 1 1 0 5 0 3 1 0 0 1 0 0 0 0 2 1 0 1
1 0 1 1 0 1 0 0 1 0 2 2 0 2 1 2 1 1 2 0 2 0 1 1 0 2 0 0 0 2 0 2 2 3 2 0 1
1 1 1 1 2 0 0 0 1 1 2 0 3 1 0 1 1 1 1 1 3 3 2 0 1 0 1 3 1 0 0 4 1 0 3 0 0
4 2 2 2 2 1 0 2 2 0 2 4]
len(meal_bin_indices)715min(meal_bin_indices)np.int64(0)max(meal_bin_indices)np.int64(5)Create Meal Data Matrix
meal_data_matrix = np.vstack(meal_glucose_data)
meal_data_matrix
array([[ nan, nan, 124., ..., 178., 184., 185.],
[121., 120., 115., ..., 86., 84., 80.],
[287., 288., 289., ..., 201., 189., 162.],
...,
[274., 278., 283., ..., 268., 281., 292.],
[223., 222., 222., ..., 324., 326., 328.],
[ 82., 85., 92., ..., 164., 163., 155.]])meal_data_matrix.shape(715, 30)Handle Missing Data
We will use a strategy of deleting rows of data that have more than 10% of bad data. If less than 10%, we will use KNN with a nearest neighbor hyperparameter (K=7).
Define Threshold for Dumping Data
# 10%
dump_thresold = 0.1
Create KNN Imputer
knn_imputer = KNNImputer(n_neighbors=7)Parse Meal Data and Handle Missing Values
cleaned_meal_glucose_data = []
cleaned_meal_bin_indices = []
cleaned_meal_carb_for_analysis_data = []

for index, row in enumerate(meal_data_matrix):

    proportion_missing_data = np.isnan(row).mean()

    if proportion_missing_data > dump_thresold:

        # Ignore this row
        #print(f"Ignoring row with {proportion_missing_data*100:.2f}% missing data")
        continue

    else:
        # The data is good, use it
        cleaned_meal_glucose_data.append(row)
        cleaned_meal_carb_for_analysis_data.append(meal_carb_for_analysis_data[index])
cleaned_meal_bin_indices.append(meal_bin_indices[index])len(cleaned_meal_glucose_data)619len(cleaned_meal_bin_indices)619Convert Cleaned Meal Glucose Data List into a Matrix
cleaned_meal_glucose_data_matrix = \
np.array(cleaned_meal_glucose_data)cleaned_meal_glucose_data_matrix.shape(619, 30)Use KNN to Impute NaNs in Cleaned Meal Data
cleaned_imputed_meal_glucose_data_matrix = \
knn_imputer.fit_transform(cleaned_meal_glucose_data_matrix)#cleaned_imputed_meal_glucose_data_matrix[0]Feature Extraction
Define Feature Extractor Helper Functions
def compute_first_derivative(glucose_data, delta_t=5):
    return np.diff(glucose_data) / delta_t
def compute_second_derivative(glucose_values, delta_t=5):
second_derivative = np.zeros(len(glucose_values) - 2)
for i in range(1, len(glucose_values) - 1):
second_derivative[i - 1] = \
(glucose_values[i + 1] - 2 * glucose_values[i] + glucose_values[i - 1]) / (delta_t ** 2)
return second_derivativedef compute_AUC(glucose_values, delta_t=5):
return simpson(glucose_values, dx=delta_t)Define Feature Extractor Function
def feature_extractor(data_matrix):

    features = []

    for row in data_matrix:
        mean_glucose = np.mean(row)
        std_glucose  = np.std(row)
        max_glucose  = np.max(row)
        min_glucose  = np.min(row)

        first_derivative = compute_first_derivative(row)
        mean_first_derivate = np.mean(first_derivative)

        if len(row) > 2:
            second_derivative = compute_second_derivative(row)
            mean_second_derivative = np.mean(second_derivative)
        else:
            mean_second_derivative = 0

        AUC = compute_AUC(row)

        time_to_peak = np.argmax(row)

        features_vector = [
            mean_glucose,
            std_glucose,
            max_glucose,
            min_glucose,
            mean_first_derivate,
            mean_second_derivative,
            AUC,
            time_to_peak
        ]

        features.append(features_vector)

    return np.array(features)
Get Feature Matrix for Cleaned Imputed Meal Data
meal_glucose_features_matrix = \
    feature_extractor(cleaned_imputed_meal_glucose_data_matrix)
#len(meal_gluxose_features_matrix[0])len(cleaned_imputed_meal_glucose_data_matrix)619len(meal_glucose_features_matrix)619len(cleaned_meal_carb_for_analysis_data)619len(cleaned_meal_bin_indices)619cleaned_meal_carb_for_analysis_data[0:5][np.float64(15.0),
np.float64(71.0),
np.float64(8.0),
np.float64(10.0),
np.float64(40.0)]cleaned_meal_bin_indices[0:5][np.int64(0), np.int64(2), np.int64(0), np.int64(0), np.int64(1)]Normalize the Feature Matrix
scaler = StandardScaler()
scaled_meal_glucose_features_matrix = \
scaler.fit_transform(meal_glucose_features_matrix)meal_glucose_features_matrix[0:5]array([[ 8.98190476e+01, 1.91175360e+01, 1.31000000e+02,
4.90000000e+01, -2.82758621e-01, -4.28571429e-03,
1.30310714e+04, 9.00000000e+00],
[ 2.14033333e+02, 4.45903452e+01, 2.89000000e+02,
1.53000000e+02, -8.62068966e-01, -4.00000000e-02,
3.10037500e+04, 2.00000000e+00],
[ 1.46833333e+02, 2.61484013e+01, 1.89000000e+02,
1.00000000e+02, -2.89655172e-01, 5.28571429e-02,
2.11329167e+04, 0.00000000e+00],
[ 2.01700000e+02, 1.21714146e+01, 2.21000000e+02,
1.77000000e+02, 1.51724138e-01, 1.85714286e-02,
2.92870833e+04, 1.80000000e+01],
[ 8.82000000e+01, 3.36426317e+01, 1.69000000e+02,
5.90000000e+01, 6.13793103e-01, -4.28571429e-03,
1.26495833e+04, 2.80000000e+01]])scaled_meal_glucose_features_matrix[0:5]array([[-1.35358146, -0.64438944, -1.34072717, -1.28537305, -0.95960069,
-0.264903 , -1.34238262, -0.8852873 ],
[ 0.90939359, 0.73923035, 1.18551723, 0.73417365, -1.97024273,
-2.54215225, 0.89878287, -1.54257823],
[-0.31487721, -0.26249029, -0.41337163, -0.29501842, -0.97163214,
3.37869579, -0.33209493, -1.73037564],
[ 0.68470103, -1.02168552, 0.09827281, 1.20022289, -0.20161916,
1.19253652, 0.68471716, -0.04019896],
[-1.38307778, 0.14457771, -0.7331494 , -1.09118587, 0.60448818,
-0.264903 , -1.3899536 , 0.89878808]])Cluster the Data
Convert Bins List into a Column Matrix
meal_bin_indices_column_vector = \
np.array(cleaned_meal_bin_indices).reshape(-1, 1)meal_bin_indices_column_vector[0:5]array([[0],
[2],
[0],
[0],
[1]])Add Bin Data to Feature Data
#combined_feature_bin_data = \
#    np.hstack((meal_gluxose_features_matrix, meal_bin_indices_column_vector))
combined_feature_bin_data = meal_glucose_features_matrix
#combined_feature_bin_data = scaled_meal_glucose_features_matrixcombined_feature_bin_data[0:5]array([[ 8.98190476e+01, 1.91175360e+01, 1.31000000e+02,
4.90000000e+01, -2.82758621e-01, -4.28571429e-03,
1.30310714e+04, 9.00000000e+00],
[ 2.14033333e+02, 4.45903452e+01, 2.89000000e+02,
1.53000000e+02, -8.62068966e-01, -4.00000000e-02,
3.10037500e+04, 2.00000000e+00],
[ 1.46833333e+02, 2.61484013e+01, 1.89000000e+02,
1.00000000e+02, -2.89655172e-01, 5.28571429e-02,
2.11329167e+04, 0.00000000e+00],
[ 2.01700000e+02, 1.21714146e+01, 2.21000000e+02,
1.77000000e+02, 1.51724138e-01, 1.85714286e-02,
2.92870833e+04, 1.80000000e+01],
[ 8.82000000e+01, 3.36426317e+01, 1.69000000e+02,
5.90000000e+01, 6.13793103e-01, -4.28571429e-03,
1.26495833e+04, 2.80000000e+01]])K-Means Clustering
number_of_bins6cleaned_meal_bin_indices[0:5][np.int64(0), np.int64(2), np.int64(0), np.int64(0), np.int64(1)]max(cleaned_meal_bin_indices)np.int64(5)min(cleaned_meal_bin_indices)np.int64(0)# Set the number of clusters for K-means
k = int(number_of_bins)
y_bins = np.array(cleaned_meal_bin_indices)
# Initialize and fit KMeans
kmeans = KMeans(n_clusters=k, random_state=123)
y_kmeans = kmeans.fit_predict(scaled_meal_glucose_features_matrix)y_kmeans[0:5]array([5, 4, 5, 4, 2], dtype=int32)y_kmeans.shape(619,)# Set the number of clusters for K-means
k = int(number_of_bins)
y_bins = np.array(cleaned_meal_bin_indices)
# Initialize and fit KMeans
kmeans = KMeans(n_clusters=k, random_state=123)
y_kmeans = kmeans.fit_predict(scaled_meal_glucose_features_matrix)
# Get cluster labels and centroids
kmeans_cluster_labels = kmeans.labels_
centroids = kmeans.cluster_centers_
pca = PCA(n_components=2)
X_pca_kmeans = pca.fit_transform(scaled_meal_glucose_features_matrix)
# Plotting the clusters found by k-means
plt.figure(figsize=(10, 5))
# Get the viridis color map and extract six colors from it
viridis = get_cmap('viridis', k)
colors = [viridis(i) for i in range(k)]
# Subplot 1: Scatter plot by k-means clusters
plt.subplot(1, 2, 1)
for i in range(k):
cluster_points = X_pca_kmeans[y_kmeans == i]
plt.scatter(cluster_points[:, 0], cluster_points[:, 1],
color=colors[i], label=f'Cluster {i + 1}', alpha=0.6, marker='o')
# Plotting the centroids after PCA transformation
centroids_pca = pca.transform(centroids)
plt.scatter(centroids_pca[:, 0], centroids_pca[:, 1],
color='red', edgecolor='black', marker='X', s=100, label='Centroids')
plt.title("K-Means Clusters")
plt.xlabel('PCA Component 1')
plt.ylabel('PCA Component 2')
plt.legend()
plt.show()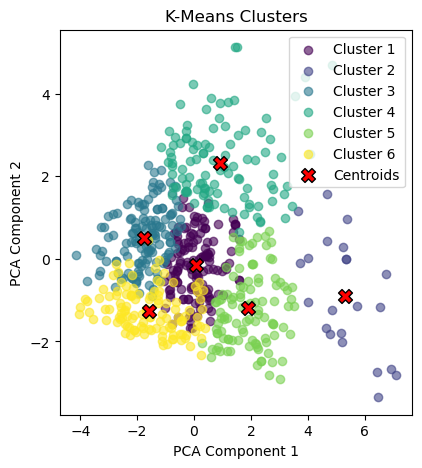
# Set the number of clusters for K-means
k = int(number_of_bins)
y_bins = np.array(cleaned_meal_bin_indices)

# Initialize and fit KMeans
kmeans = KMeans(n_clusters=k, random_state=123)
y_kmeans = kmeans.fit_predict(scaled_meal_glucose_features_matrix)
# Get cluster labels and centroids
kmeans_cluster_labels = kmeans.labels_
centroids = kmeans.cluster_centers_
pca = PCA(n_components=2)
X_pca = pca.fit_transform(scaled_meal_glucose_features_matrix)
# Plotting the clusters found by k-means
plt.figure(figsize=(10, 5))
# Subplot 1: Scatter plot by original bins
plt.subplot(1, 2, 1)
plt.scatter(
np.arange(0, y_bins.shape[0]),
y_bins,
c=y_bins,
cmap='rainbow',
marker='o')
plt.title("Original Bins")
plt.xlabel("Sample Index")
plt.ylabel("Bin Label")
# Subplot 2: Scatter plot by k-means clusters
plt.subplot(1, 2, 2)
plt.scatter(
np.arange(0, y_kmeans.shape[0]),
y_kmeans,
c=y_kmeans,
cmap='rainbow',
marker='o')
plt.title("K-Means Clusters")
plt.xlabel("Sample Index")
plt.ylabel("Bin Label")
plt.show()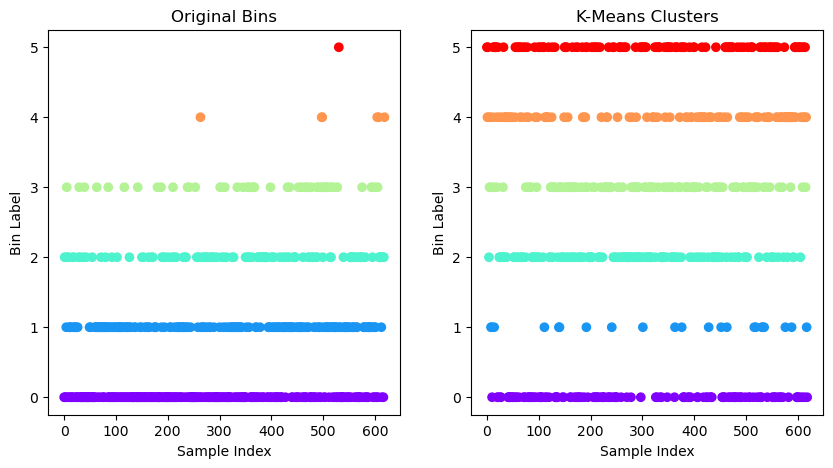
Compute K-Means SSE
# Compute SSE
SSE_kmeans = np.float64(kmeans.inertia_)
SSE_kmeansnp.float64(1840.9904638055532)DBSCAN Clustering
# Set the number of clusters for K-means
k = int(number_of_bins)
y_bins = np.array(cleaned_meal_bin_indices)

# Initialize and fit KMeans
kmeans = KMeans(n_clusters=k, random_state=123)
y_kmeans = kmeans.fit_predict(scaled_meal_glucose_features_matrix)

# Get cluster labels and centroids
kmeans_cluster_labels = kmeans.labels_
centroids = kmeans.cluster_centers_

pca = PCA(n_components=2)
X_pca = pca.fit_transform(scaled_meal_glucose_features_matrix)

# Plotting the clusters found by k-means
plt.figure(figsize=(10, 5))

# Get the viridis color map and extract six colors from it
viridis = get_cmap('viridis', k)
colors = [viridis(i) for i in range(k)]

# Subplot 1: Scatter plot by k-means clusters
plt.subplot(1, 2, 1)
for i in range(k):
    cluster_points = X_pca[y_kmeans == i]
    plt.scatter(cluster_points[:, 0], cluster_points[:, 1],
                color=colors[i], label=f'Cluster {i + 1}', alpha=0.6, marker='o')

# Plotting the centroids after PCA transformation
centroids_pca = pca.transform(centroids)
plt.scatter(centroids_pca[:, 0], centroids_pca[:, 1],
            color='red', edgecolor='black', marker='X', s=100, label='Centroids')

plt.title("K-Means Clusters")
plt.xlabel('PCA Component 1')
plt.ylabel('PCA Component 2')
plt.legend()

# Get axis limits to keep the same scale for the second plot
x_lim = plt.xlim()
y_lim = plt.ylim()

# Subplot 2: Scatter plot by DBSCAN clusters
plt.subplot(1, 2, 2)

eps = 280  # Maximum distance between two points to be considered neighbors
min_samples = 15  # Minimum number of points in a neighborhood to form a dense region

dbscan = DBSCAN(eps=eps, min_samples=min_samples)
y_dbscan = dbscan.fit_predict(meal_glucose_features_matrix)

# Create a color palette for the clusters found by DBSCAN, including noise (-1) as black
unique_labels = set(y_dbscan)
dbscan_colors = [plt.cm.viridis(float(i) / (max(unique_labels) if max(unique_labels) > 0 else 1))
                 for i in unique_labels]

# Color each point by DBSCAN cluster, use black for noise points
for label in unique_labels:
    if label == -1:
        # Noise points are labeled as -1
        plt.scatter(X_pca[y_dbscan == label, 0], X_pca[y_dbscan == label, 1],
                    color='black', s=10, label='Noise', alpha=0.6, marker='x')
    else:
        plt.scatter(X_pca[y_dbscan == label, 0], X_pca[y_dbscan == label, 1],
                    color=dbscan_colors[label], label=f'Cluster {label + 1}', alpha=0.6, marker='o')

plt.title("DBSCAN Clusters")
plt.xlabel('PCA Component 1')
plt.ylabel('PCA Component 2')
plt.xlim(x_lim)  # Apply same x-axis limits as K-means plot
plt.ylim(y_lim)  # Apply same y-axis limits as K-means plot
plt.legend()

plt.show()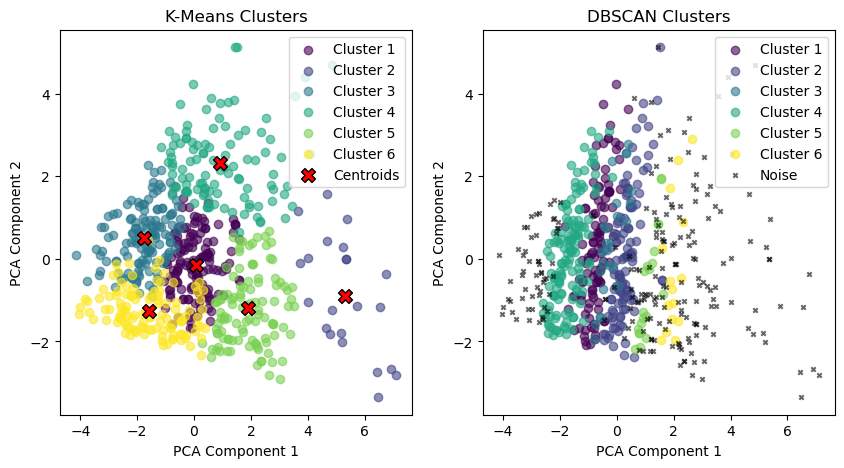
y_bins = np.array(cleaned_meal_bin_indices)
# DBSCAN Parameters
eps = 280 # Maximum distance between two points to be considered neighbors
min_samples = 15 # Minimum number of points in a neighborhood to form a dense region
# Fit DBSCAN
dbscan = DBSCAN(eps=eps, min_samples=min_samples)
y_dbscan = dbscan.fit_predict(meal_glucose_features_matrix)
# Adjust labels to start from 0 (handle noise points separately)
# Noise points are marked as -1, so we'll make their label `max_label + 1`
adjusted_y_dbscan = y_dbscan.copy()
max_label = y_dbscan.max()
# Replace all noise labels (-1) with a new label which is `max_label + 1`
adjusted_y_dbscan[adjusted_y_dbscan == -1] = max_label + 1
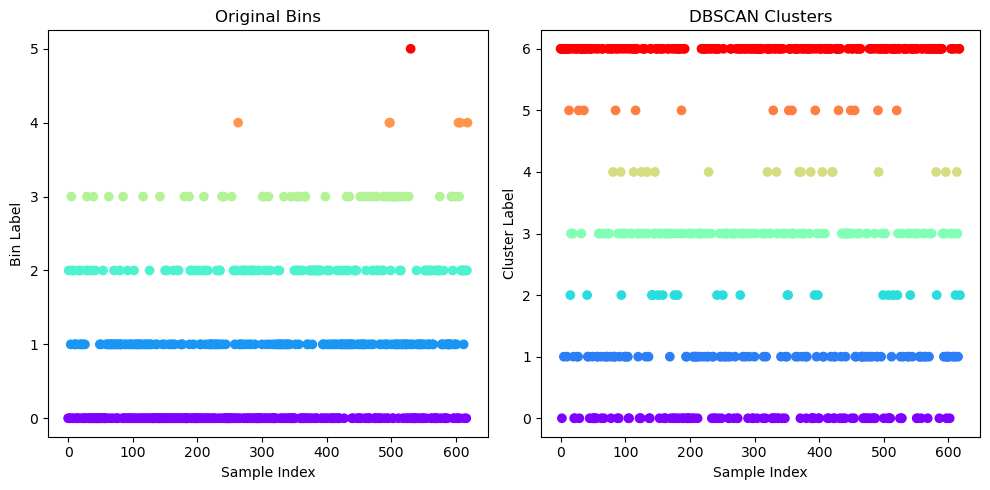
# Plotting the clusters found by DBSCAN and original bins
plt.figure(figsize=(10, 5))
# Subplot 1: Scatter plot by original bins
plt.subplot(1, 2, 1)
plt.scatter(
np.arange(0, y_bins.shape[0]),
y_bins,
c=y_bins,
cmap='rainbow',
marker='o')
plt.title("Original Bins")
plt.xlabel("Sample Index")
plt.ylabel("Bin Label")
# Subplot 2: Scatter plot by DBSCAN clusters
plt.subplot(1, 2, 2)
plt.scatter(
np.arange(0, adjusted_y_dbscan.shape[0]),
adjusted_y_dbscan,
c=adjusted_y_dbscan,
cmap='rainbow',
marker='o')
plt.title("DBSCAN Clusters")
plt.xlabel("Sample Index")
plt.ylabel("Cluster Label")
plt.tight_layout()
plt.show()
Compute DBSCAN SSE
# Get unique clusters excluding noise (-1)
unique_clusters = set(y_dbscan) - {-1}

# Initialize SSE
SSE_dbscan = 0

# Loop over each cluster to compute SSE
for cluster in unique_clusters:
    # Get points in the current cluster
    cluster_points = meal_glucose_features_matrix[y_dbscan == cluster]

    # Compute the pseudo-centroid (mean of points in the cluster)
    pseudo_centroid = np.mean(cluster_points, axis=0)

    # Compute SSE for this cluster
    sse_cluster = np.sum((cluster_points - pseudo_centroid) ** 2)

    # Add the cluster's SSE to the total SSE
    SSE_dbscan += sse_cluster

print(f"Approximate SSE for DBSCAN (excluding noise): {SSE_dbscan}")
Approximate SSE for DBSCAN (excluding noise): 365871520.5756363
Compute Entropy and Purity
K Means Cluster Bin Matrix
df_kmeans_cluster = \
    pd.DataFrame(
        {'Cluster': kmeans_cluster_labels,
         'Bin': np.array(cleaned_meal_bin_indices)}
    )
df_kmeans_cluster
Loading...
df_kmeans_cluster_bin_matrix = \
    pd.crosstab(
        df_kmeans_cluster['Cluster'],
        df_kmeans_cluster['Bin'])
df_kmeans_cluster_bin_matrix
Loading...
DBSCAN Cluster Bin Matrix
#y_dbscandf_dbscan_cluster = \
pd.DataFrame(
{'Cluster': y_dbscan,
'Bin': np.array(cleaned_meal_bin_indices)}
)
df_dbscan_cluster = \
df_dbscan_cluster[df_dbscan_cluster['Cluster'] != -1]
df_dbscan_clusterLoading...
df_dbscan_cluster_bin_matrix = \
    pd.crosstab(
        df_dbscan_cluster['Cluster'],
        df_dbscan_cluster['Bin'])
df_dbscan_cluster_bin_matrix
Loading...
Define Entropy Function
def entropy(entries):
    entries = entries[entries > 0]
    return -np.sum(entries * np.log2(entries))
Calculate K Means Row Entropy Values
k_means_entropy_values = \
    df_kmeans_cluster_bin_matrix.apply(lambda row: entropy(row / row.sum()), axis=1)
k_means_entropy_values
Cluster
0 1.830430
1 1.983050
2 1.681496
3 1.869815
4 1.828204
5 1.816162
dtype: float64Calculate DBSCAN Row Entropy Values
dbscan_entropy_values = \
    df_dbscan_cluster_bin_matrix.apply(lambda row: entropy(row / row.sum()), axis=1)
dbscan_entropy_values
Cluster
0 1.806700
1 1.886256
2 1.603856
3 1.716418
4 1.647731
5 1.989898
dtype: float64Calculate Total Entropy
Calculate K Means Cluster Sizes
k_means_cluster_sizes = df_kmeans_cluster_bin_matrix.sum(axis=1)
k_means_cluster_sizes
Cluster
0 133
1 22
2 135
3 106
4 106
5 117
dtype: int64Calculate DBSCAN Cluster Sizes
dbscan_cluster_sizes = df_dbscan_cluster_bin_matrix.sum(axis=1)
dbscan_cluster_sizes
Cluster
0 106
1 106
2 25
3 131
4 20
5 15
dtype: int64Total Data Points
total_data_points = len(meal_glucose_features_matrix)
total_data_points619K-Means Total Entropy
k_means_total_entropy = \
    np.sum(k_means_cluster_sizes * k_means_entropy_values) / total_data_points
k_means_total_entropynp.float64(1.807039149934111)DBSCAN Total Entropy
dbscan_total_entropy = \
    np.sum(dbscan_cluster_sizes * dbscan_entropy_values) / total_data_points
dbscan_total_entropynp.float64(1.161879812576486)Calculate Total Purity
Calculate K Means Purity Values
k_means_purity_values = \
    df_kmeans_cluster_bin_matrix.apply(lambda row: row.max() / row.sum(), axis=1)
k_means_purity_values
Cluster
0 0.436090
1 0.318182
2 0.533333
3 0.386792
4 0.377358
5 0.478632
dtype: float64Calculate DBSCAN Purity Values
dbscan_purity_values = \
    df_dbscan_cluster_bin_matrix.apply(lambda row: row.max() / row.sum(), axis=1)
dbscan_purity_values
Cluster
0 0.386792
1 0.405660
2 0.640000
3 0.496183
4 0.500000
5 0.266667
dtype: float64K-Means Total Purity
k_means_total_purity = \
    np.sum(k_means_cluster_sizes * k_means_purity_values) / total_data_points
k_means_total_puritynp.float64(0.44264943457189015)DBSCAN Total Purity
dbscan_total_purity = \
    np.sum(dbscan_cluster_sizes * dbscan_purity_values) / total_data_points
dbscan_total_puritynp.float64(0.28917609046849757)Create Results File
results = [
    SSE_kmeans,
    SSE_dbscan,
    k_means_total_entropy,
    dbscan_total_entropy,
    k_means_total_purity,
    dbscan_total_purity
]
results
[np.float64(1840.9904638055532),
np.float64(365871520.5756363),
np.float64(1.807039149934111),
np.float64(1.161879812576486),
np.float64(0.44264943457189015),
np.float64(0.28917609046849757)]results_matrix_1x6 = np.array(results).reshape(1, 6)
results_matrix_1x6array([[1.84099046e+03, 3.65871521e+08, 1.80703915e+00, 1.16187981e+00,
4.42649435e-01, 2.89176090e-01]])np.savetxt('Result.csv', results_matrix_1x6, delimiter=',', fmt='%10.5f')